006 Rainfall Bars
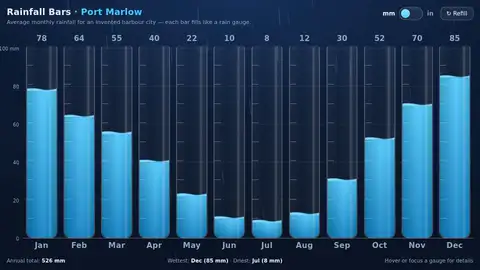
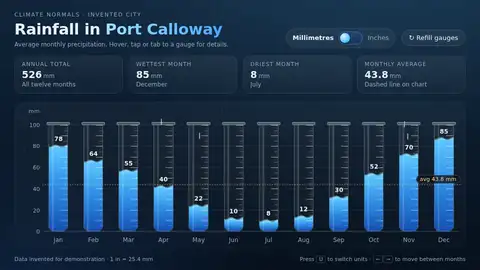
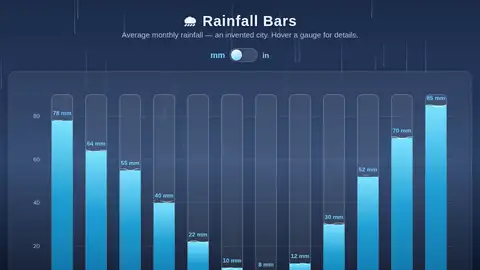
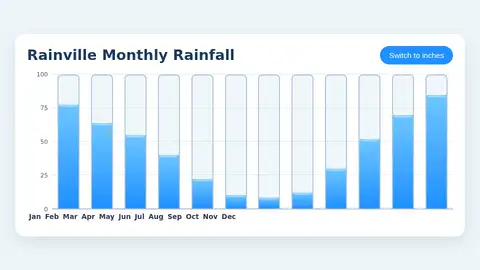
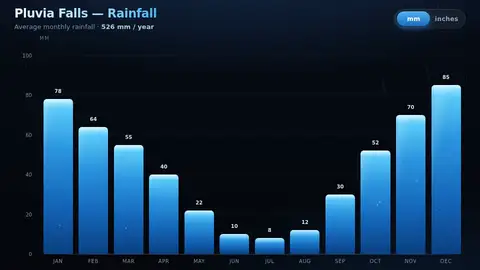
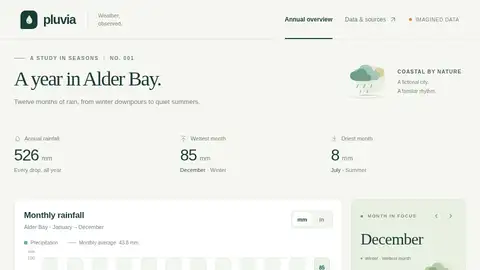
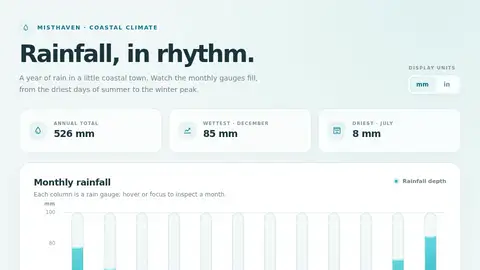
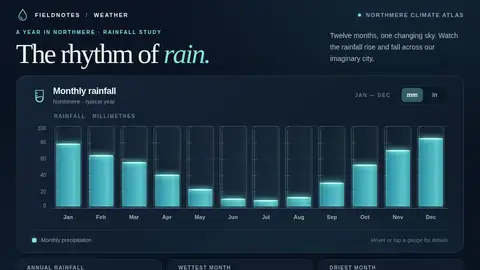
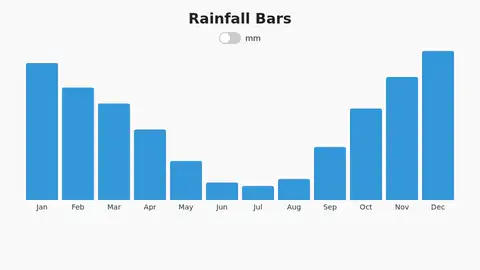
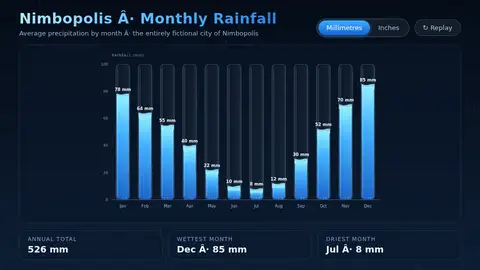
Rainfall Bars: An animated bar chart of monthly rainfall for an invented city (Jan 78mm, Feb 64, Mar 55, Apr 40, May 22, Jun 10, Jul 8, Aug 12, Sep 30, Oct 5…
More
1 test · 10 finished runs (0 agent, 10 raw one-shot) · 10 live demos
The prompt
Rainfall Bars: An animated bar chart of monthly rainfall for an invented city (Jan 78mm, Feb 64, Mar 55, Apr 40, May 22, Jun 10, Jul 8, Aug 12, Sep 30, Oct 52, Nov 70, Dec 85). Bars fill like rain gauges, hovering shows a tooltip, and a toggle switches between millimetres and inches. Build it as ONE self-contained HTML file: inline CSS and JavaScript only, no libraries or frameworks, and no external requests of any kind (no CDNs, web fonts, images or audio files); anything visual or audible is made in code (HTML/CSS, SVG, Canvas, WebGL or WebAudio). It must work when opened directly from disk, fit the browser window responsively, and run without console errors. Output ONLY the complete HTML file, starting with <!DOCTYPE html> and ending with </html>, with no explanation or markdown fences.
Same prompt, all models: step through 12 runsIn the gallery: one player, arrow keys or swipe.