066 Stock Candlesticks
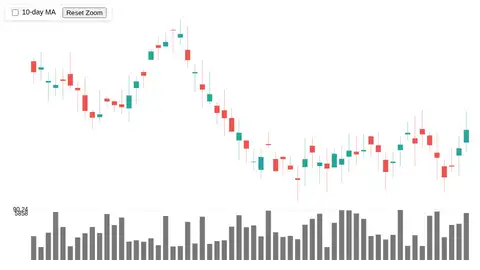
Stock Candlesticks: A candlestick chart of 60 days of invented stock prices with volume bars below, a crosshair that snaps to candles showing open/high/low/c…
More
1 test · 1 finished runs (0 agent, 1 raw one-shot) · 1 live demo
The prompt
Stock Candlesticks: A candlestick chart of 60 days of invented stock prices with volume bars below, a crosshair that snaps to candles showing open/high/low/close, a 10-day moving average overlay toggle, and drag-to-zoom on the time axis with a reset zoom button. Build it as ONE self-contained HTML file: inline CSS and JavaScript only, no libraries or frameworks, and no external requests of any kind (no CDNs, web fonts, images or audio files); anything visual or audible is made in code (HTML/CSS, SVG, Canvas, WebGL or WebAudio). It must work when opened directly from disk, fit the browser window responsively, and run without console errors. Output ONLY the complete HTML file, starting with <!DOCTYPE html> and ending with </html>, with no explanation or markdown fences.
Same prompt, all models: step through 2 runsIn the gallery: one player, arrow keys or swipe.