Glass dashboard launch
[Task] Create a 24-second product-launch video for a fictional analytics app called Lumora, at 1920x1080, 30 fps.
More
1 test · 2 finished runs (2 agent, 0 raw one-shot) · 2 videos
The prompt
[Task] Create a 24-second product-launch video for a fictional analytics app called Lumora, at 1920x1080, 30 fps. A frosted-glass dashboard assembles panel by panel, comes alive with data and ends on a logo lockup. [Scenes] 1. 0-3 s: Darkness. Three soft colour orbs drift into place and bloom. A thin glass sheet slides up from below, catching a moving specular highlight. The text "Your numbers, finally clear." fades in word by word. 2. 3-8 s: The camera pulls back and tilts slightly as the dashboard builds. A sidebar, a header, four KPI cards and two large chart panels drop in with staggered springs, each with a blurred backdrop and a 1 px light border. 3. 8-13 s: The charts animate. The revenue line draws left to right with a gradient fill rising under it, the channel donut sweeps into segments, and the KPI numbers count up from zero. 4. 13-18 s: A cursor glides in on a curved path. It hovers over the September point and a tooltip springs out, then it clicks the "Region" tab. The bar chart morphs bars into their new heights, and a toggle flips to dark-glass mode. 5. 18-21 s: The camera dollies in on the retention card, where the circular progress ring fills to 92%. All the panels then fan apart in 3D depth. 6. 21-24 s: The panels fold into a single glass tile that becomes the Lumora logomark (a stylised lens of three overlapping arcs). The wordmark and the tagline "Analytics you can see through" settle in. [Style] Palette: #0B0F1F night, #7C5CFF violet, #22D3EE cyan, #F472B6 rose, #F8FAFC frost white. Clean geometric sans with tabular figures for every number. Glass panels use backdrop blur, a subtle noise layer, inner highlights and soft coloured shadows. Motion uses spring entries with a light overshoot, a 60 ms stagger between siblings and ease-in-out camera moves. [Data] Monthly revenue ($k), Apr-Sep: 42, 51, 48, 63, 71, 88. KPIs: Active users 18,420 · MRR $88.2k · Churn 1.8% · NPS 64. Channels: Organic 41%, Referral 27%, Paid 19%, Partners 13%. Regions (signups): North 3,120 · South 2,480 · East 4,050 · West 2,760. Retention: 92%. [Wow] - Real parallax depth: the background orbs, the panels and the cursor move at three distinct depths during camera moves. - A specular light sweep travels across every glass edge in sync with each panel landing. - The bar chart morph interpolates both height and colour, with no pop or jump. - The panel-to-logo fold is one continuous, shape-preserving transformation. [Rules] - Every frame is drawn in code (SVG, canvas, CSS or WebGL). No image files, no image generation, no external assets beyond fonts. - Deterministic: no unseeded randomness at render time. - Text must be crisp, spelled correctly and readable at 1080p. - No hard cuts between scenes: every change is a designed transition. - All charts must use the exact values given in the Data section. [Harness notes] Render the final video to out.mp4 (1920x1080, 24 s). Write everything into the working directory. HyperFrames 0.8.70 is already installed for you in the current directory: node_modules is pre-installed and read-only, so do not run npm install or npx --yes; use the local hyperframes command (for example hyperframes init <dir> --example blank, then hyperframes render). Render the final video yourself to out.mp4 in the current directory. You may take snapshots and inspect your own output (headless chromium is available at /usr/bin/chromium) and iterate on your own before finishing.
Same prompt, all models: step through 2 runsIn the gallery: one player, arrow keys or swipe.
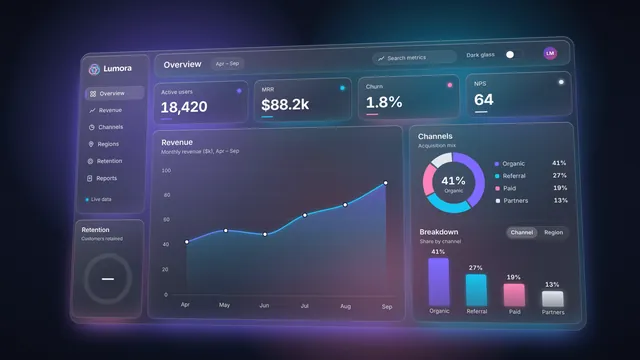 Rendered video
Claude Opus 5.5
Claude Code 2.1.280
skills on · Claude Code 2.1.280 + Remotion/HyperFrames skills
Rendered video from the run
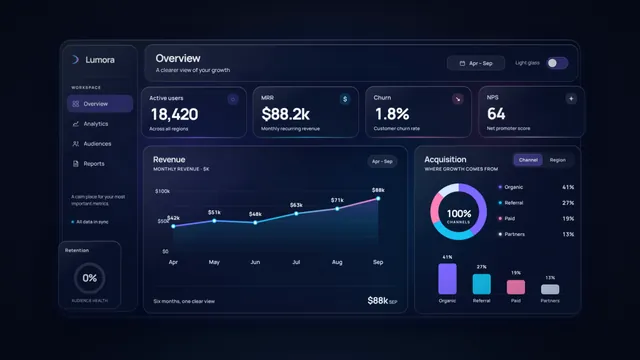 Rendered video
GPT-6 Sol
Codex CLI 0.156.1
skills on · Codex CLI 0.156.1 + Remotion/HyperFrames skills
Rendered video from the run