Scatter, waffle, histogram morph
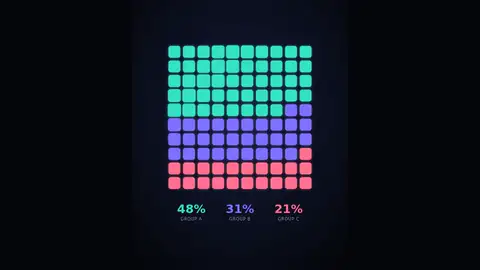
100 dots fly from a scatter plot into a 10x10 waffle chart of three colour groups (48, 31, 21), regroup into a three-bar histogram, then scatter back and rep…
More
1 test · 1 finished runs (0 agent, 1 raw one-shot) · 1 live demo
The prompt
Create a studio-quality motion graphic: 100 small dots start scattered like a scatter plot with axes, then fly into a 10x10 waffle chart where 3 colour groups (48, 31, 21) fill in order with their percentages, then regroup into a 3-bar histogram of the same groups, then scatter back and repeat. Requirements: - A single self-contained HTML file: inline CSS and JavaScript only, SVG for all graphics, no canvas, no external libraries, fonts, images or network requests. - Expressive easing (ease-in-out, overshoot, staggered delays) and true morphing: elements visibly travel between states, never a plain crossfade. - Dark, modern design with a cohesive colour palette; portrait 4:5 layout, scaled to fit the browser window and centred. - Motion starts immediately at page load (something is already moving in the first half second) and loops seamlessly, about 12-16 seconds per loop. - Drive all animation with requestAnimationFrame and performance.now; no user interaction needed. - No text beyond what the graphic itself needs (labels, values). No titles, buttons or UI. Reply with only the complete HTML file.
Same prompt, all models: step through 1 runsIn the gallery: one player, arrow keys or swipe.