Fruit Sales Bar Chart
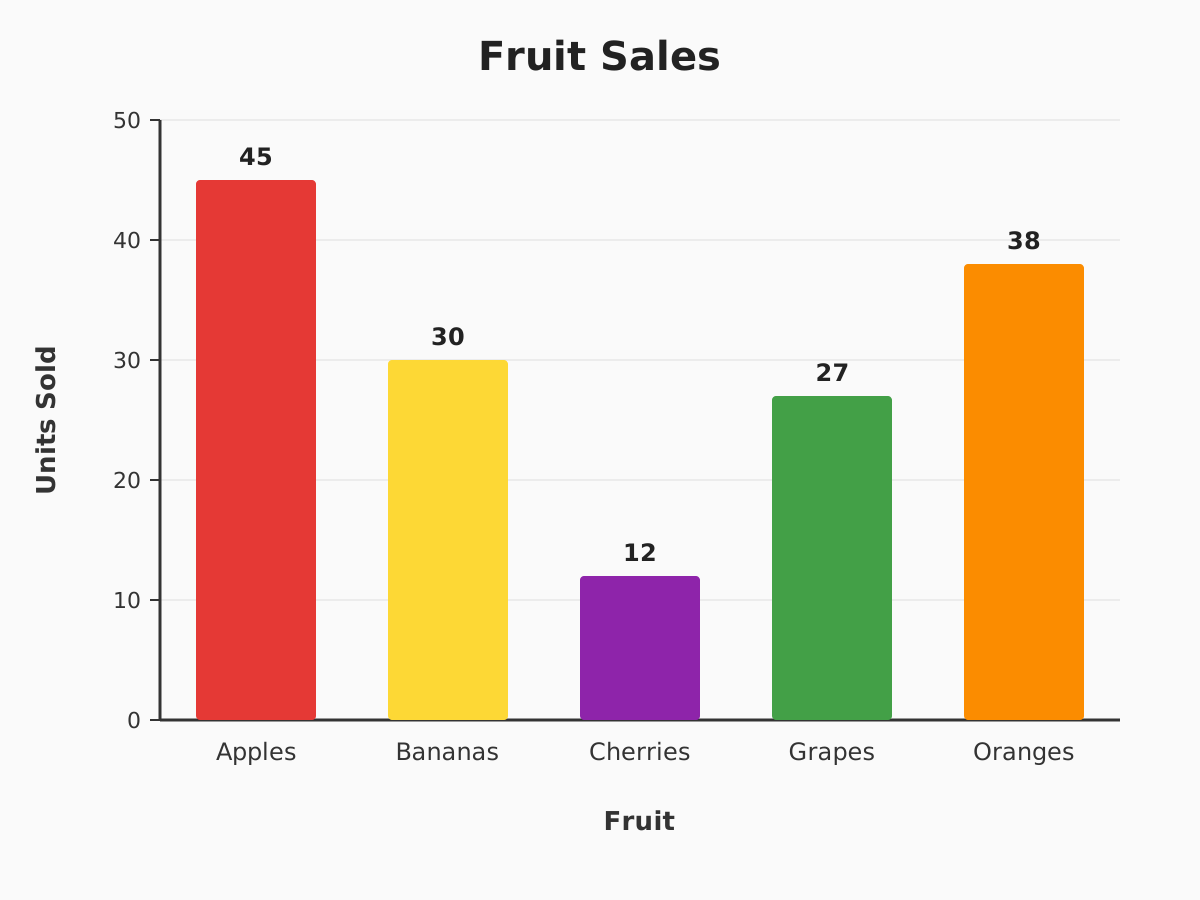
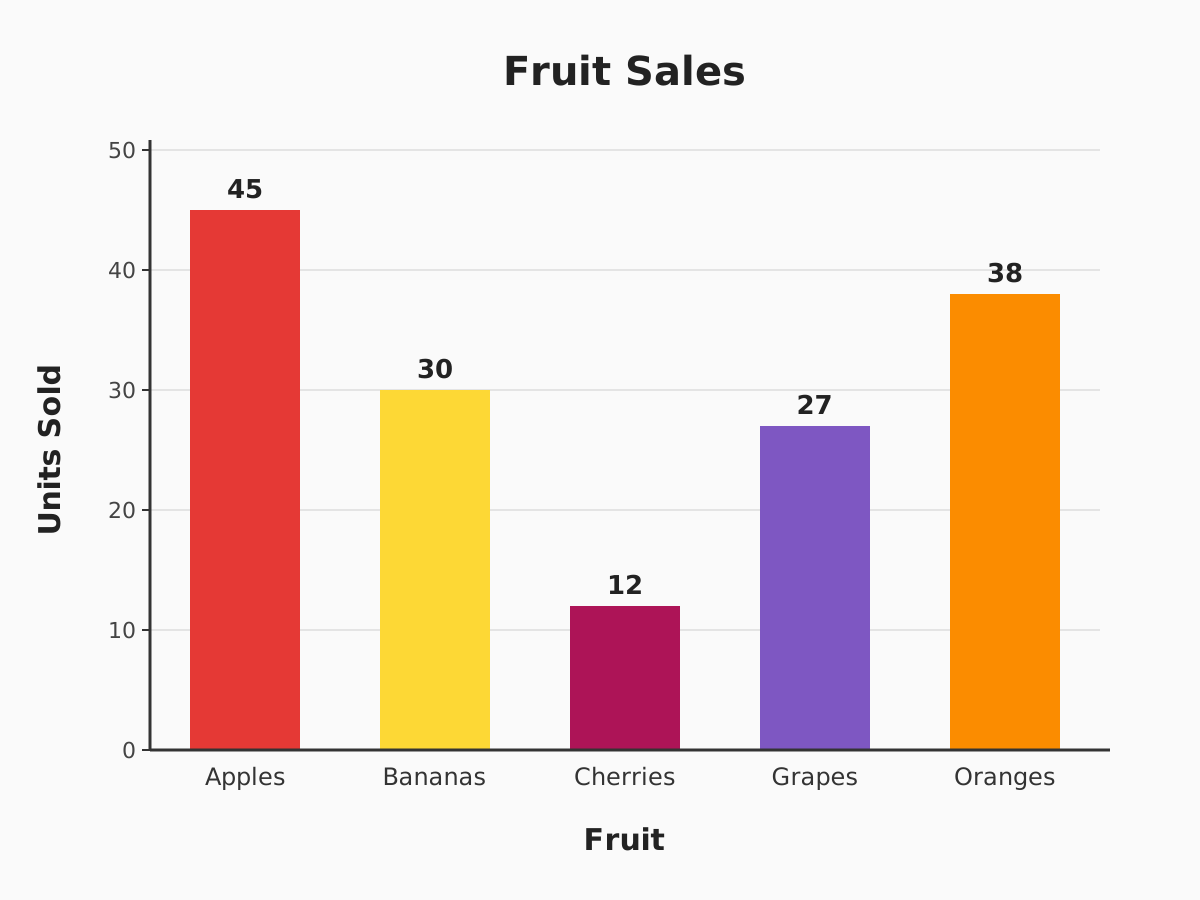
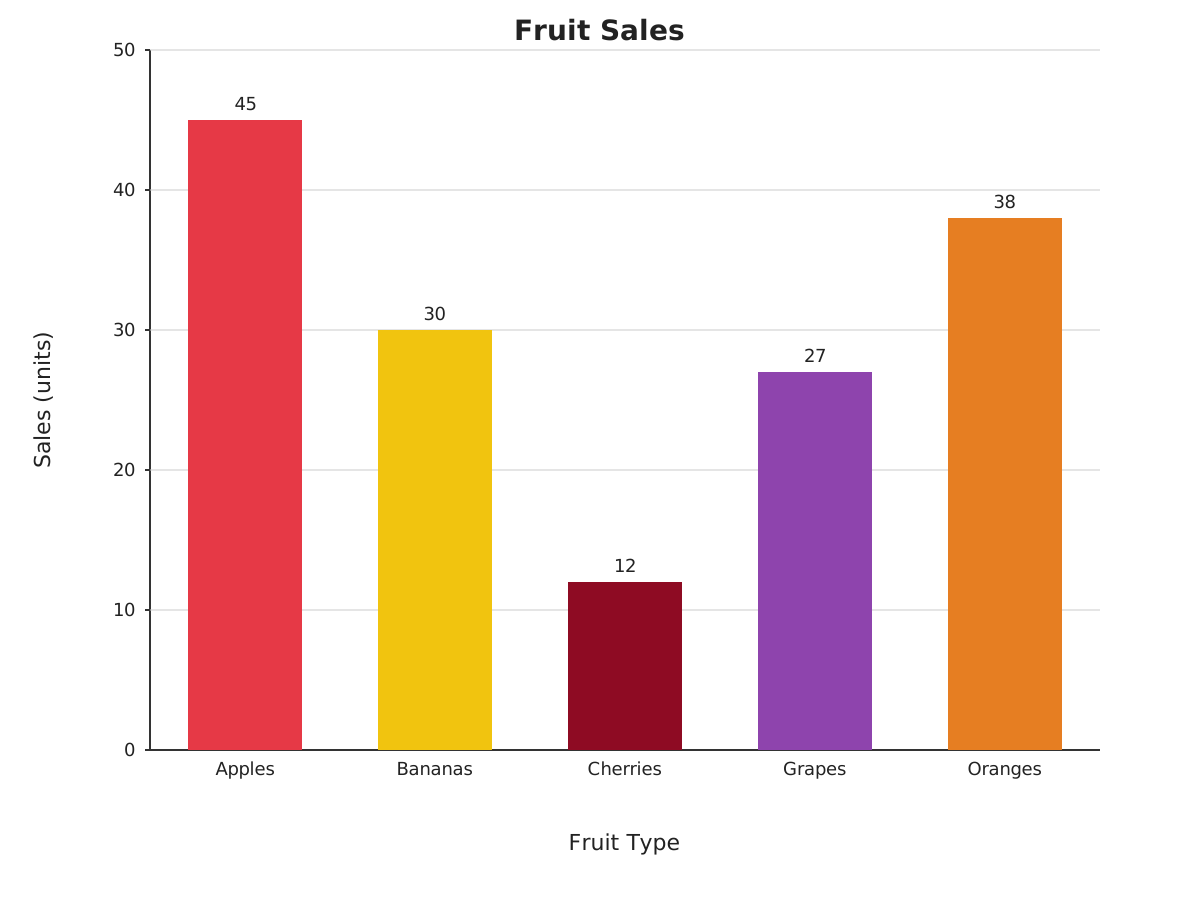
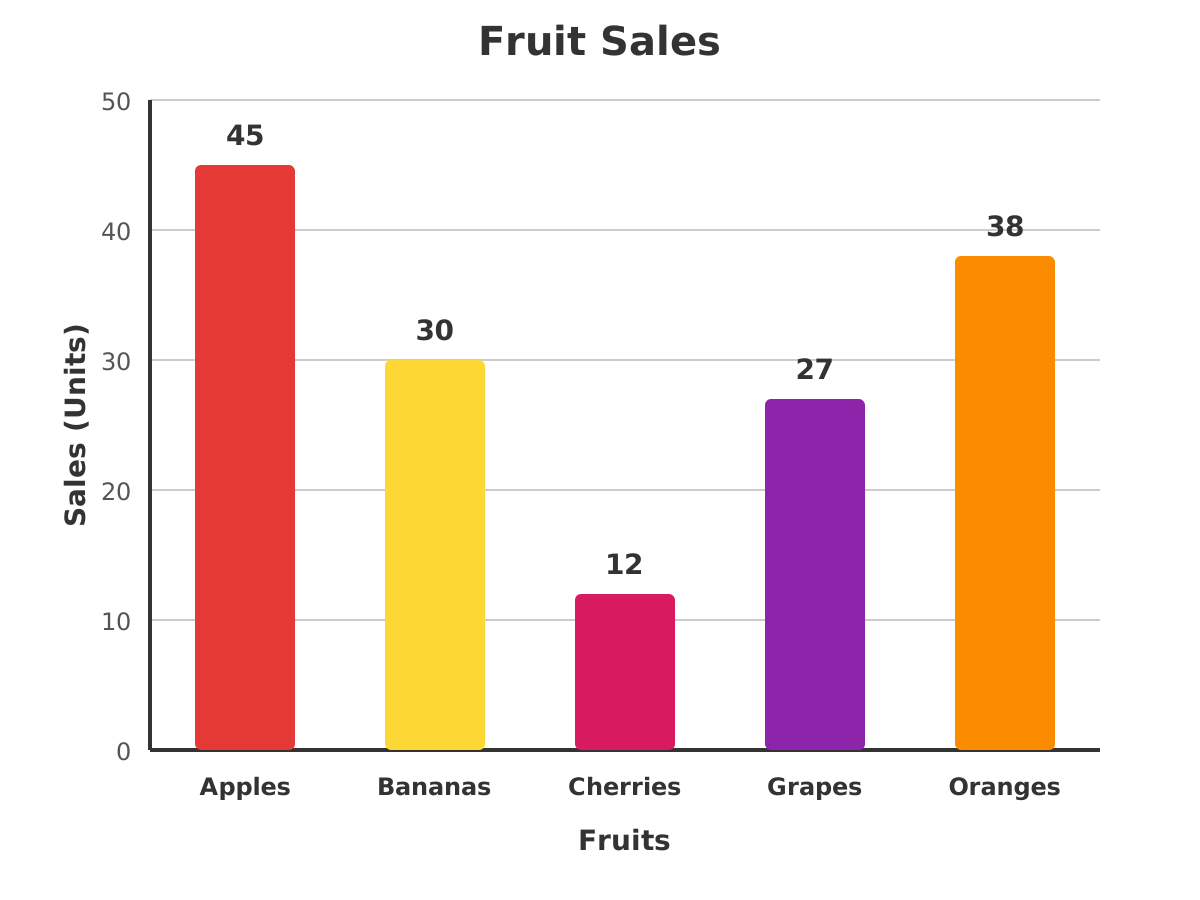
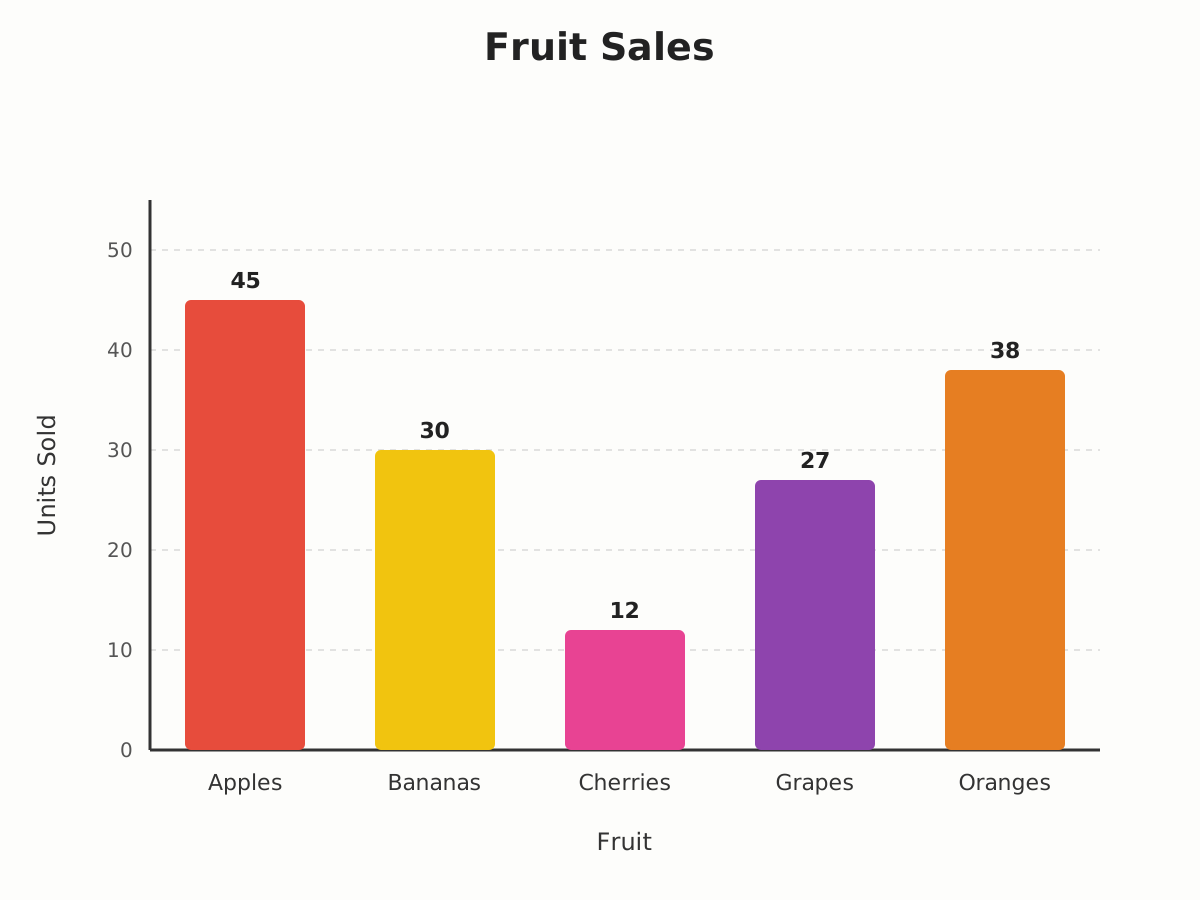
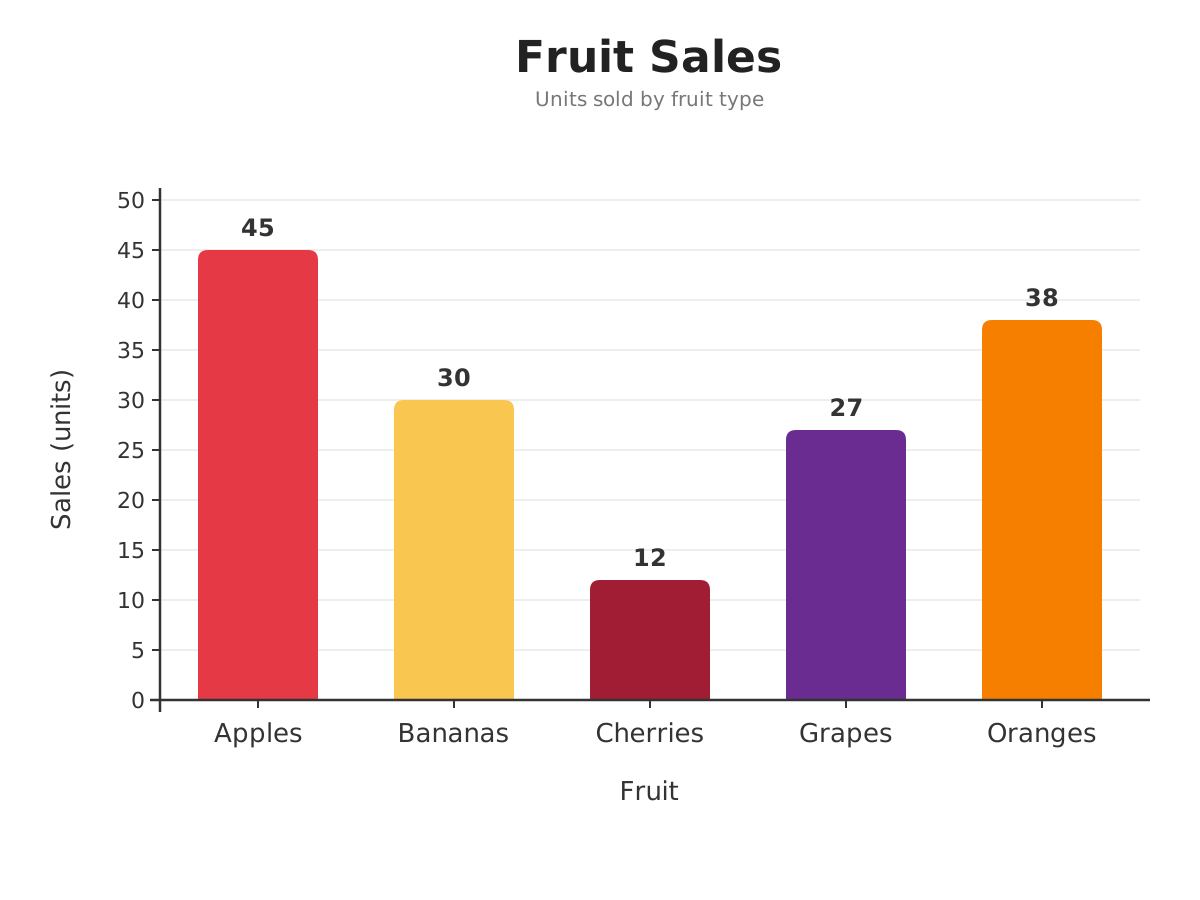
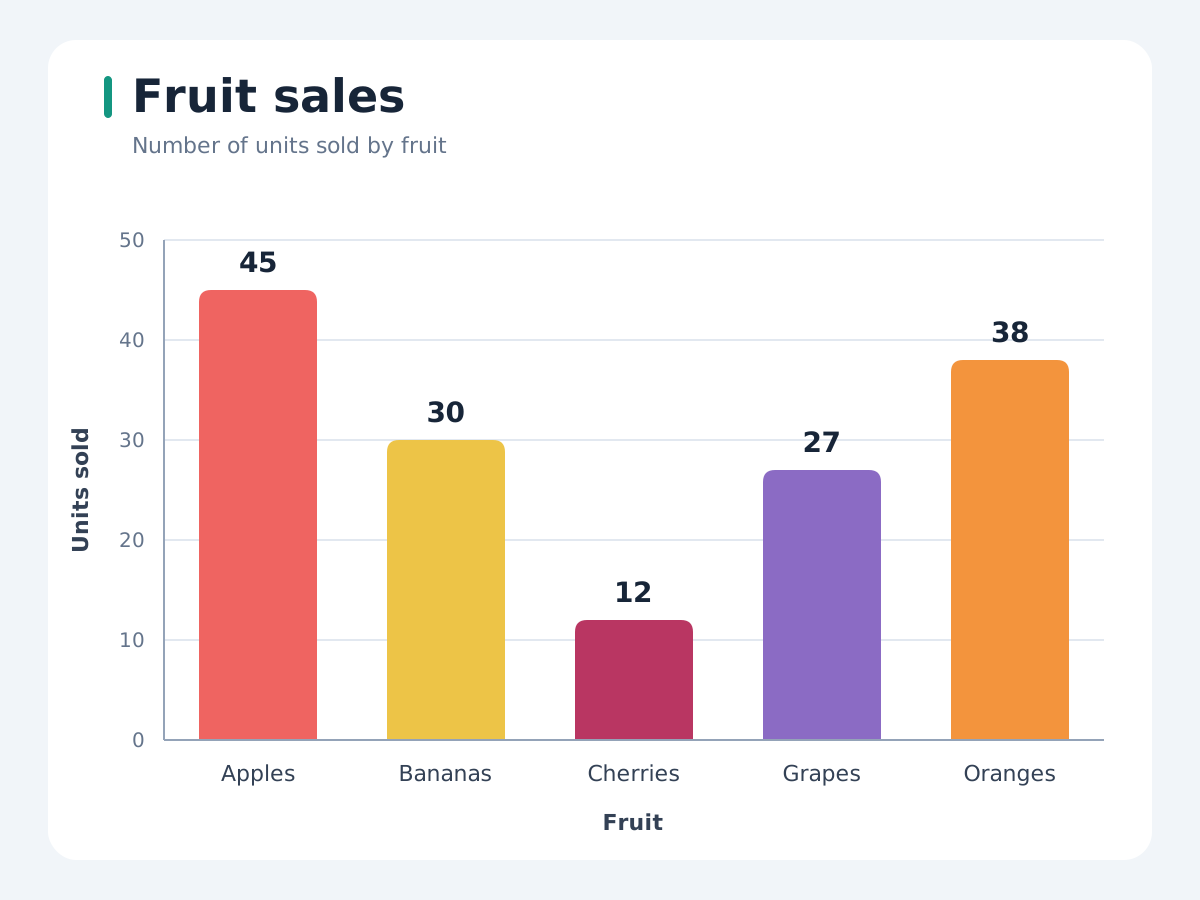
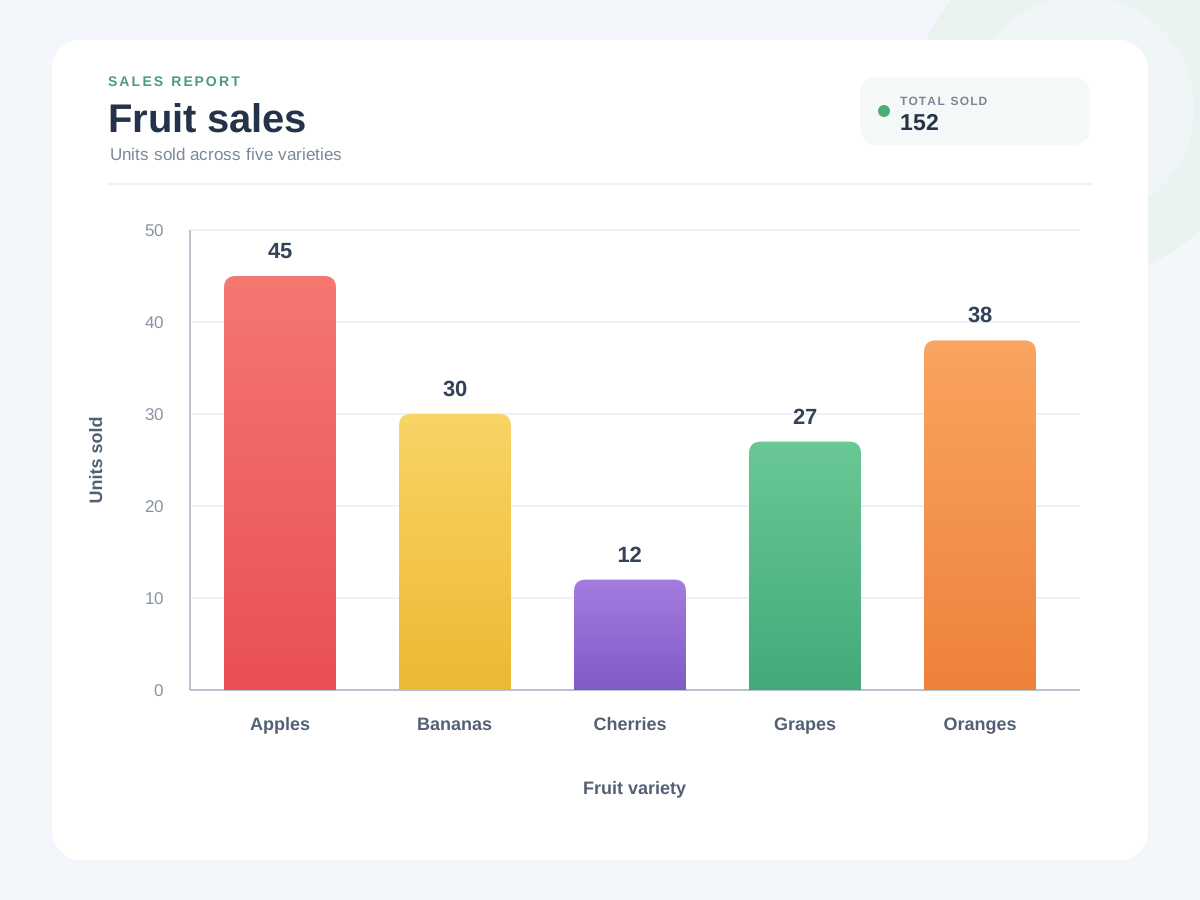
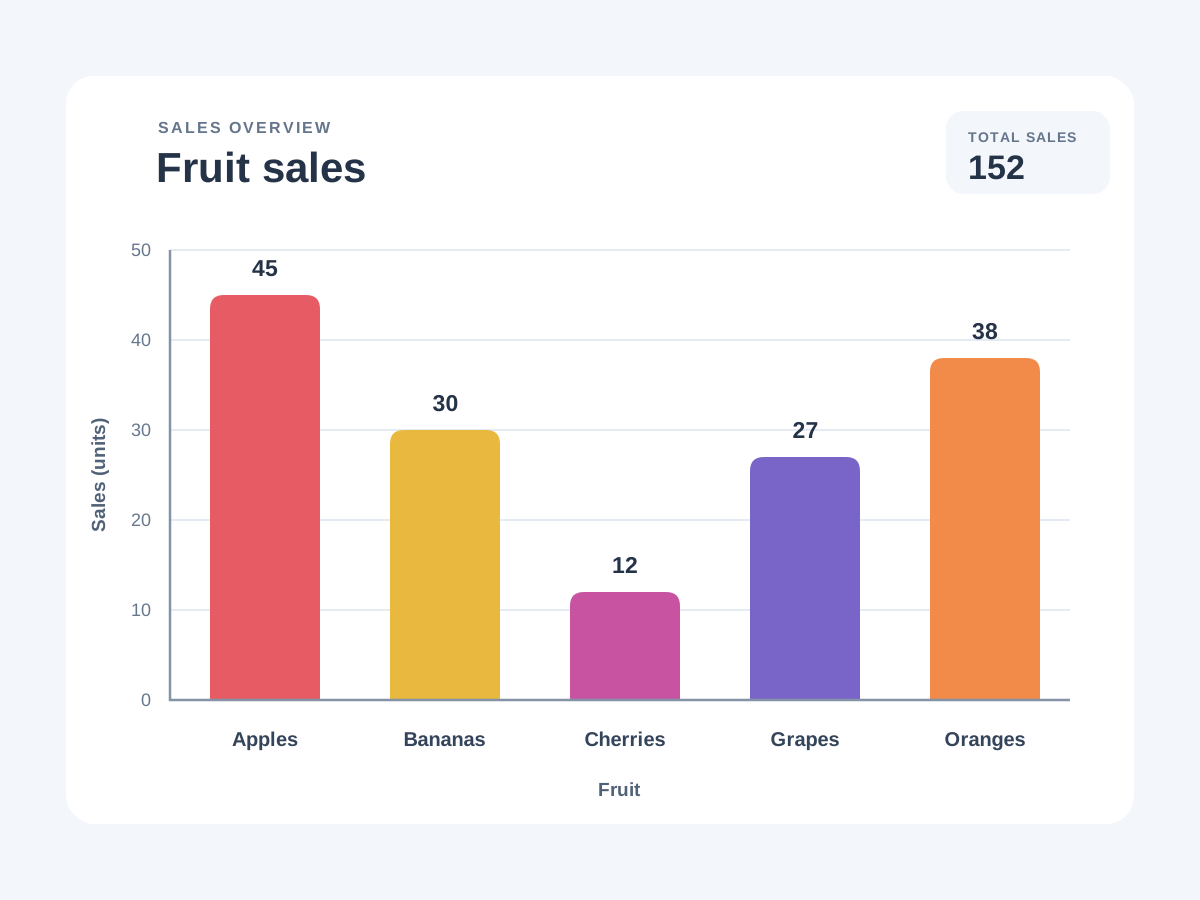
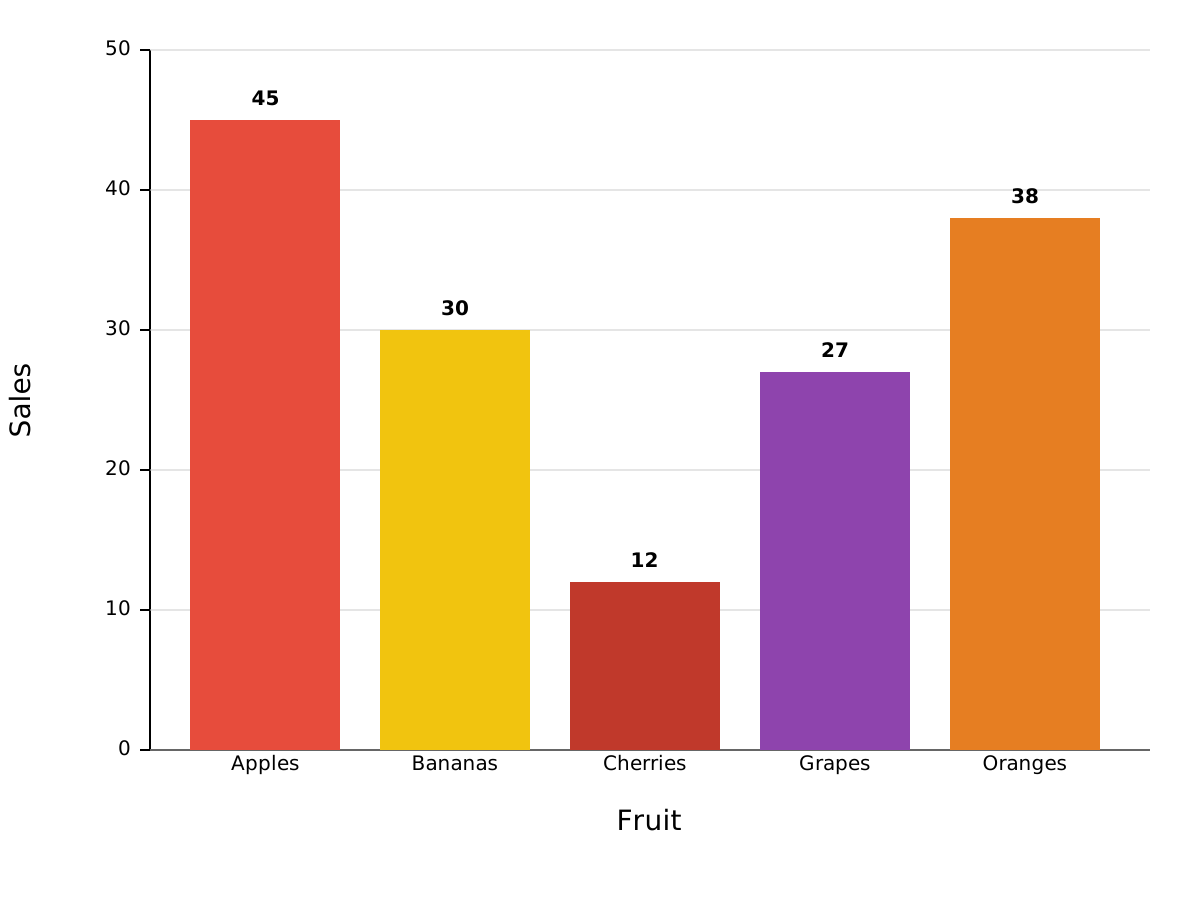
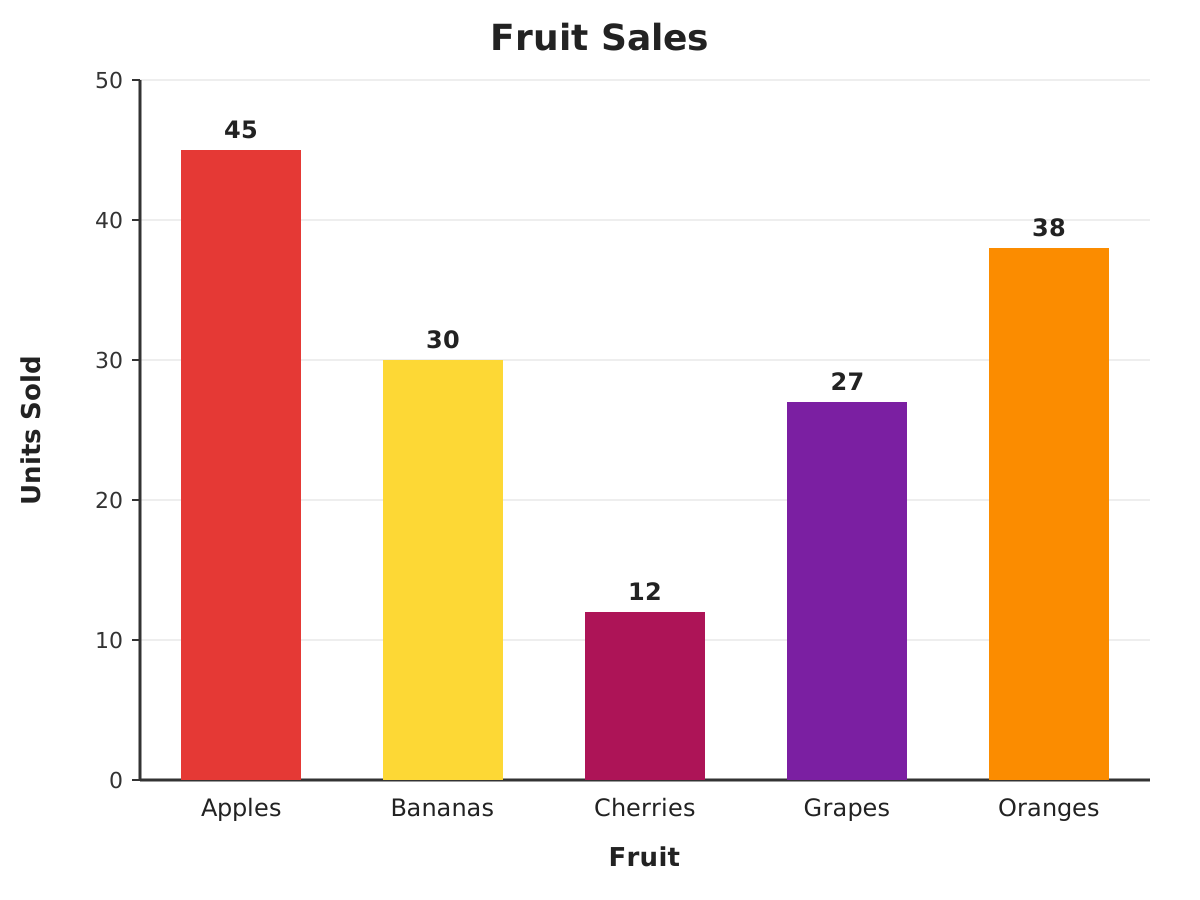
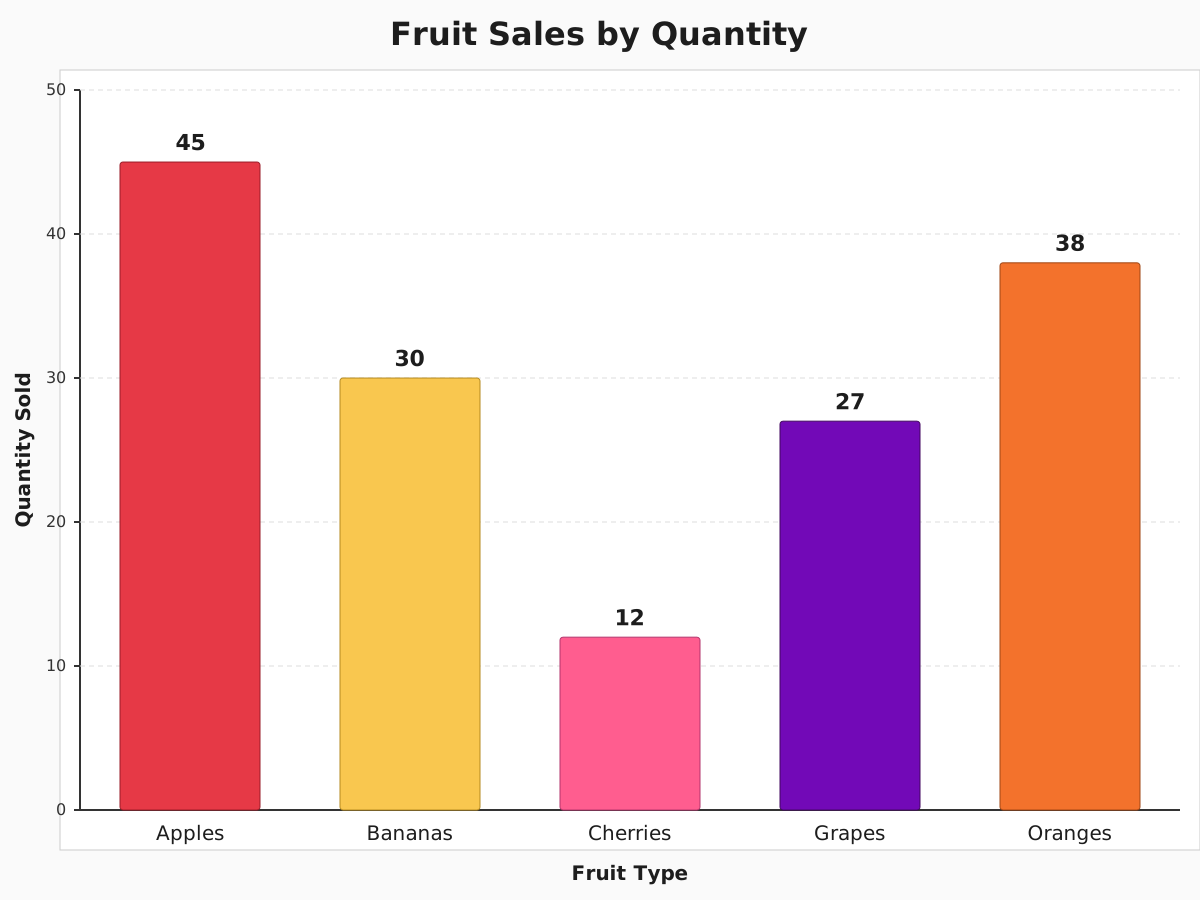
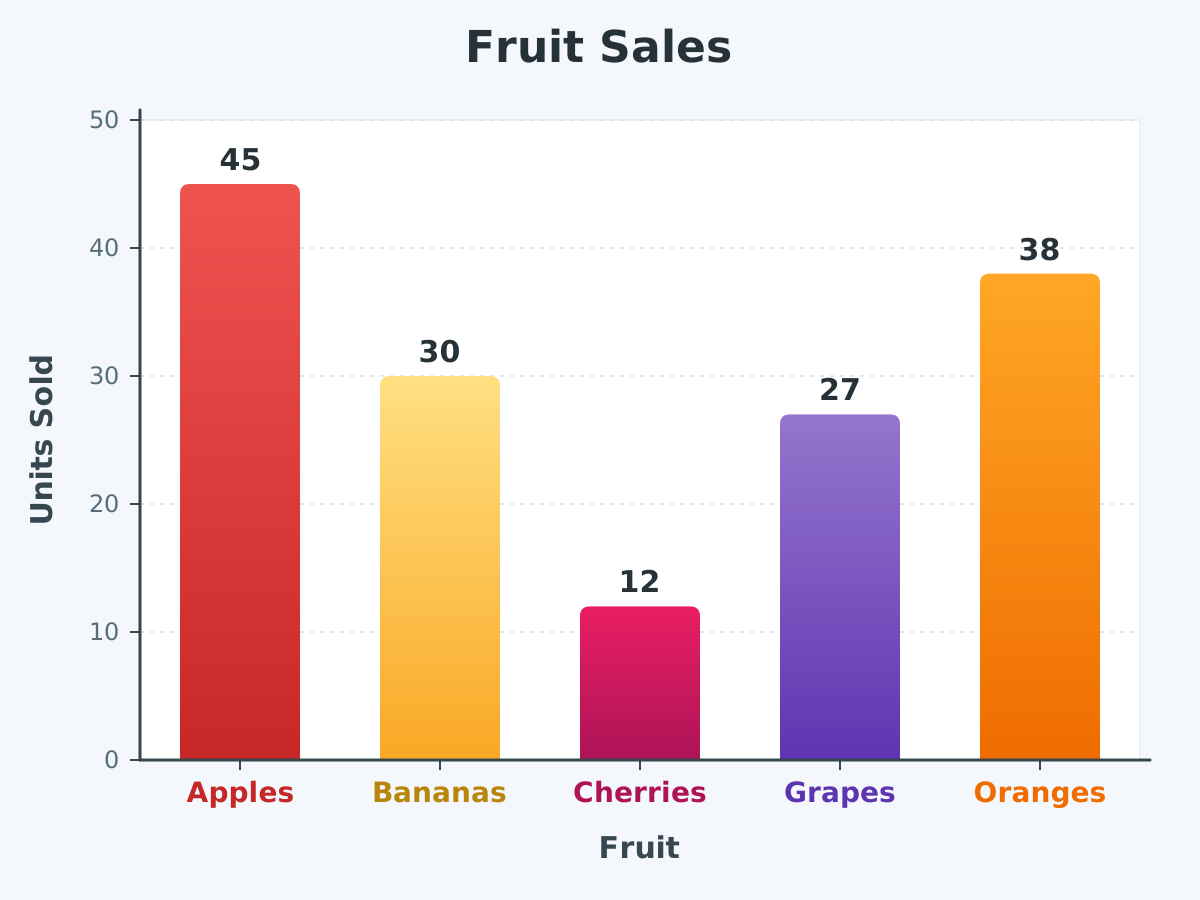
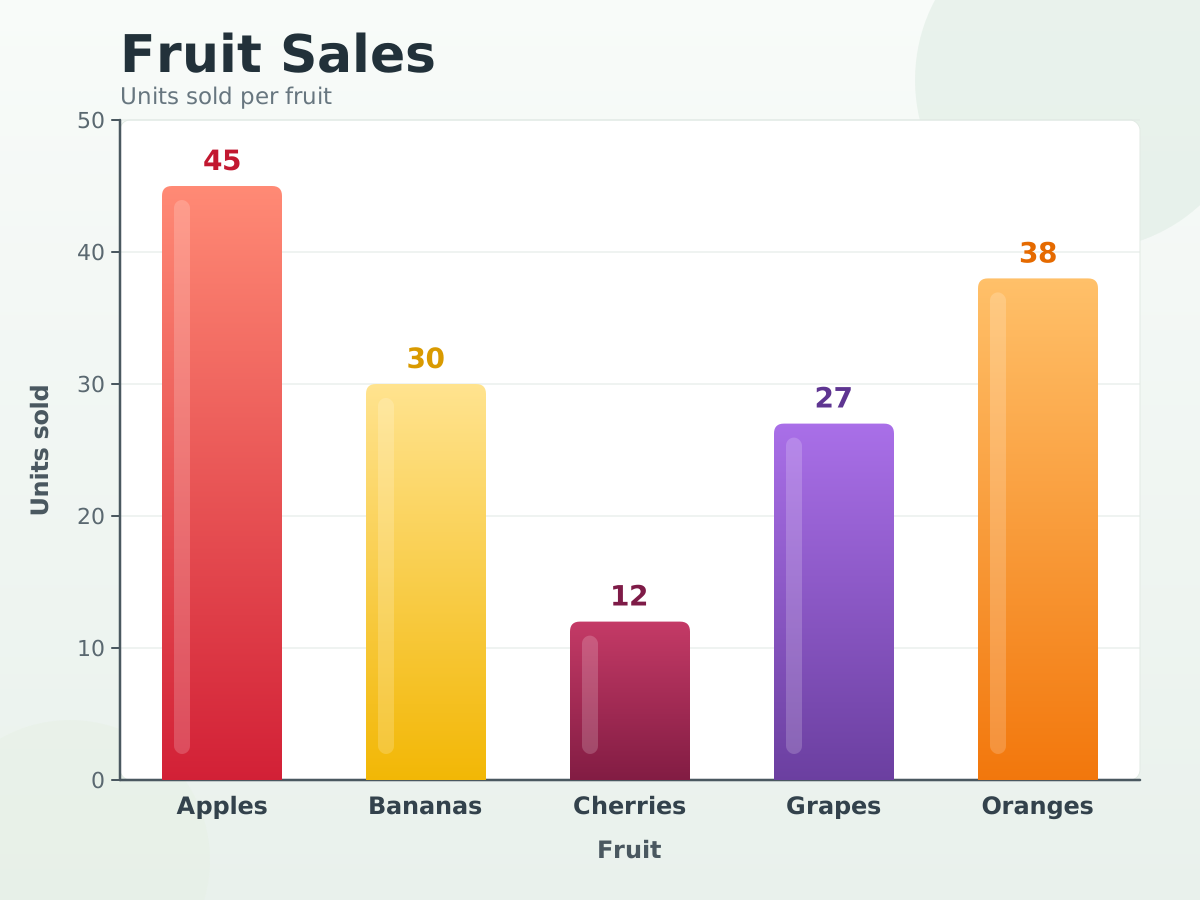
Create a single self-contained SVG illustration of a bar chart of fruit sales with labelled axes: apples 45, bananas 30, cherries 12, grapes 27 and oranges 3…
More
1 test · 14 finished runs (0 agent, 14 raw one-shot)
The prompt
Create a single self-contained SVG illustration of a bar chart of fruit sales with labelled axes: apples 45, bananas 30, cherries 12, grapes 27 and oranges 38, each bar a different colour. Use viewBox="0 0 1200 900" with width="1200" height="900". No external assets, no raster images, no external fonts (generic font families such as sans-serif are fine), no scripts. Output ONLY the complete SVG code, starting with <svg and ending with </svg>, with no explanation or markdown fences.
Same prompt, all models: step through 14 runsIn the gallery: one player, arrow keys or swipe.