GPT-6 Astra in Codex CLI 0.156.1
skills off
Zoom, inline player and more ways to view
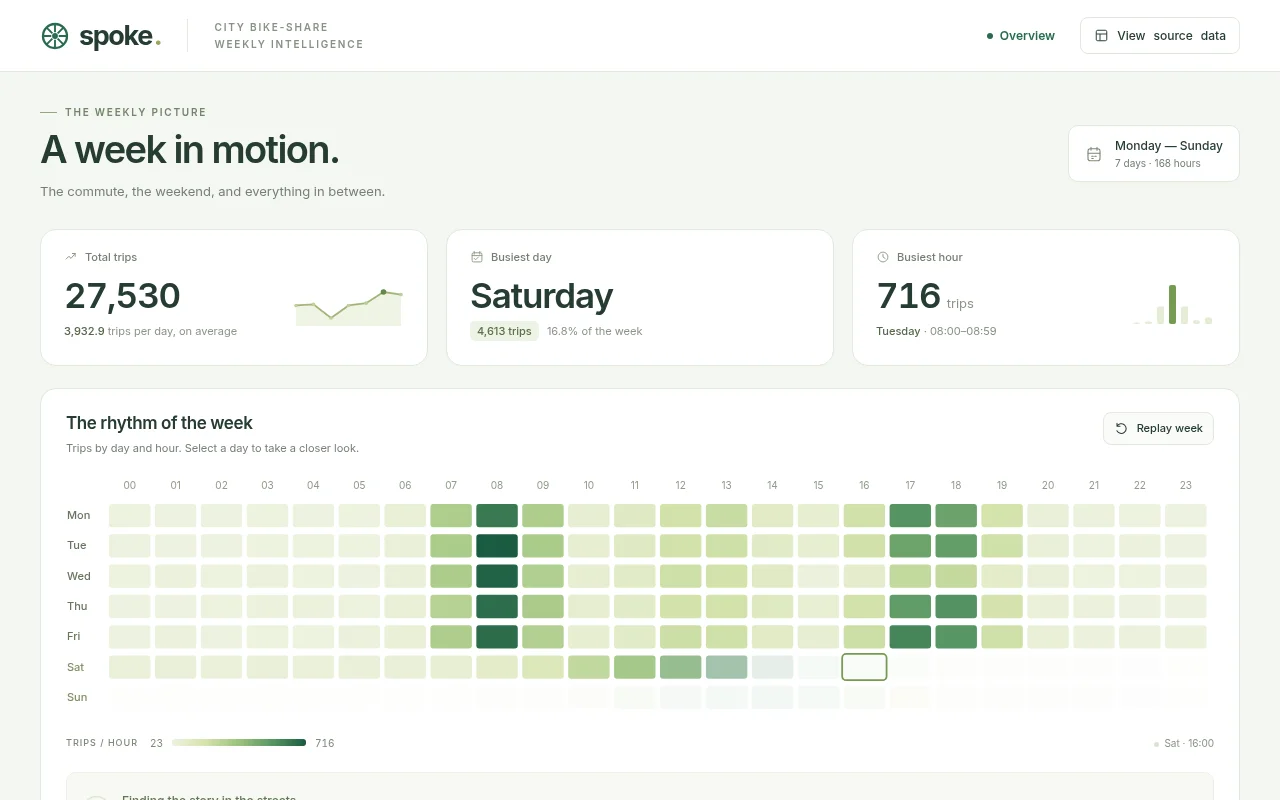
The model's own page, run in a sandboxed frame only when you ask (a page that needs its own origin opens in a new tab on a separate demo site). Phones get a full-screen player capped at 1.5x pixel density (2x on larger screens) so it stays smooth; the original page runs uncapped. Tap inside for sound.
Wall time 18m 10sCost $2.80 estimated
Review
No verdict yet.
The full review
OK. Finished on its own after 18.2 min.
Scores
AI judge
Not scored
No rubric for this prompt
Visitor votes and reviewer grades are not available yet.
- AI judge
- AI judge: the test runner (model claude-opus-5-5), scoring by visual review of the 1600 px render against the pre-registered rubric. No AI-judge score exists for this result: there is no rubric for this prompt, so no score is shown and none is made up.
- Visitors
- Public voting with a blind reveal is coming: you score the output first, then see the other scores.
- Reviewer
- The reviewer's own grade appears here once it is added.
Scores compare results for the same prompt only. AI-judge boards rank runs within one prompt, equal totals sharing a rank; scores from different prompts are never averaged.
Downloads
Files actually published for this run. Original output, site-made previews and post-run conversions are labelled separately.
The exact prompt
as run, 2,473 characters. Every result for this prompt
Build an interactive dashboard for one week of a city bike-share scheme from the exact dataset below (CSV: trips started per hour, one row per day, columns h00 to h23). Embed the data in the page verbatim and compute every number from it; do not invent or alter any value.

day,h00,h01,h02,h03,h04,h05,h06,h07,h08,h09,h10,h11,h12,h13,h14,h15,h16,h17,h18,h19,h20,h21,h22,h23
Mon,26,24,24,26,23,25,49,311,627,313,67,119,199,231,107,70,205,546,492,197,45,27,25,24
Tue,24,23,24,25,25,26,45,322,716,319,69,119,201,214,106,69,206,485,513,212,48,25,27,23
Wed,26,27,26,27,25,24,48,317,694,301,72,104,215,200,111,32,86,251,248,94,45,26,26,23
Thu,24,23,26,27,27,26,49,284,663,320,69,104,199,201,121,62,201,516,550,191,46,27,23,24
Fri,23,27,24,25,25,27,50,310,664,295,70,105,220,208,109,66,218,589,540,210,51,27,30,28
Sat,41,42,38,43,40,42,47,62,94,142,255,357,458,582,583,505,352,265,179,147,125,101,64,49
Sun,42,40,40,39,43,41,49,61,93,144,226,371,450,538,575,443,386,252,173,141,111,86,66,47

The dashboard needs: a 7 x 24 heatmap (days by hours) with a clear colour legend; a line chart of the average hourly profile for weekdays versus the weekend; a bar chart of total trips per day; KPI cards for total trips, the busiest day, and the single busiest hour of the week (day and hour); and an automatic callout that spots the anomaly in the data (one weekday evening that is far below the other weekdays at the same hours) and names it. Clicking a day highlights that day's row in the heatmap and draws its hourly line over the profile chart; hovering any heatmap cell shows its exact count. Draw the charts yourself with SVG or Canvas. So the page is alive without input, on load the heatmap fills in hour by hour like a clock sweeping across the week (about 5 seconds), then the anomaly callout appears. Make it look like a polished product, readable on desktop and phone.

Save it as index.html in the current directory: one self-contained file with inline CSS and JavaScript only, no libraries or frameworks, and no external requests of any kind (no CDNs, web fonts, images or audio files). It must work when opened directly from disk, fit any window from a 390 px wide phone to a desktop, and run without console errors. You may serve it locally and open it in headless chromium (/usr/bin/chromium, software WebGL, no GPU) to screenshot and inspect your own output, and iterate on your own before finishing. Close any browser you open as soon as you've taken your screenshot.
How it was made
Versions saved during the run
3 intermediate outputs, in the order the model wrote them.


No transcript was delivered with this result.
Cost breakdown
Headline cost $2.80, estimated from the token counts at list price.
| Tokens by type | Tokens | $ per 1M | Cost |
|---|---|---|---|
| Input (uncached) | 45 | $10.00 | $0.0004 |
| Cache write | 54,999 | $10.00 | $0.5500 |
| Cache read | 488,490 | $1.00 | $0.4885 |
| Output | 35,316 | $50.00 | $1.7658 |
| of which reasoning | 11,419 | billed as output |
- Total computed from tokens
- $2.8047
- Total reported by the harness
- none
Computed from harness-reported token counts x list prices. Cache writes priced at the input rate (the price table has no separate cache-write price).
Prices: Project price table (vendor list prices), 2026-09-22.
Run notes
- frozen prompt (written): written 2026-10-01 for the MR new-categories expansion (owner request: expand model review with new kinds of tests); category data_dashboards; zero results
- plain CODEX_HOME copy (config.toml only, run work/ trusted; no AGENTS.md/skills/state)
- Mode: interactive TUI in tmux (160x48), inside bubblewrap sandbox
- Isolation audit: outside paths seen
- Renderer: inline SVG (first <svg> at index.html line 152) in one self-contained HTML file; no libraries, no CDN, no external assets. No WebGPU or WebGL needed.
- Card video: the run's own video.mp4 (H.264 yuv420p, unchanged). Poster: the run's own render.png.
- Same frozen prompt as the other rows on this test; configurations differ and all rows are unscored, so this is not a head-to-head result.