Data dashboards
8 tests, 26 runs (25 finished). The same prompt for each model, side by side: tap a picture to run the page live.
More
Interactive dashboards built from one exact dataset given in the prompt, so every model works from the same numbers: each test's models side by side, live.
8 tests · 25 finished runs (25 agent, 0 raw one-shot) · 25 live demos
Bikeshare week Test page · 5 finished of 5
The prompt (the same for every model)
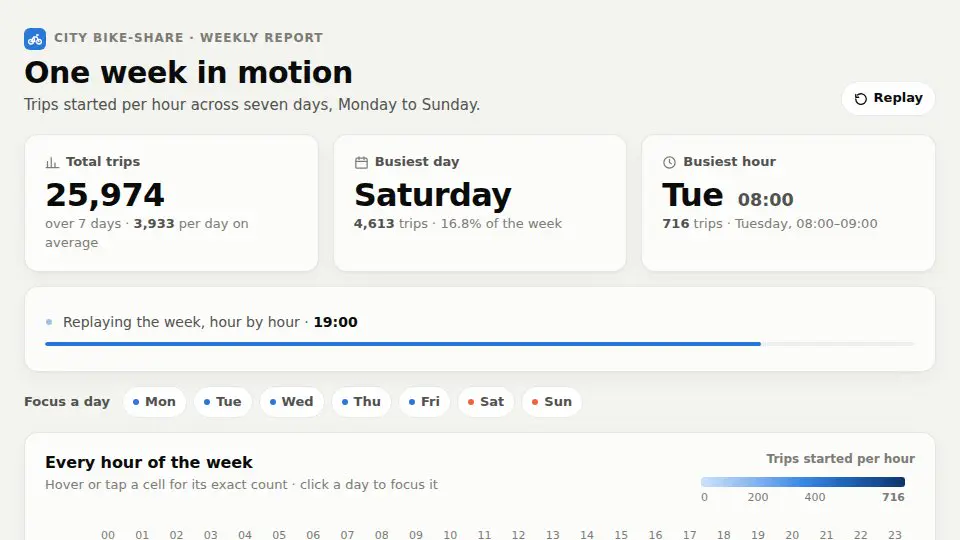
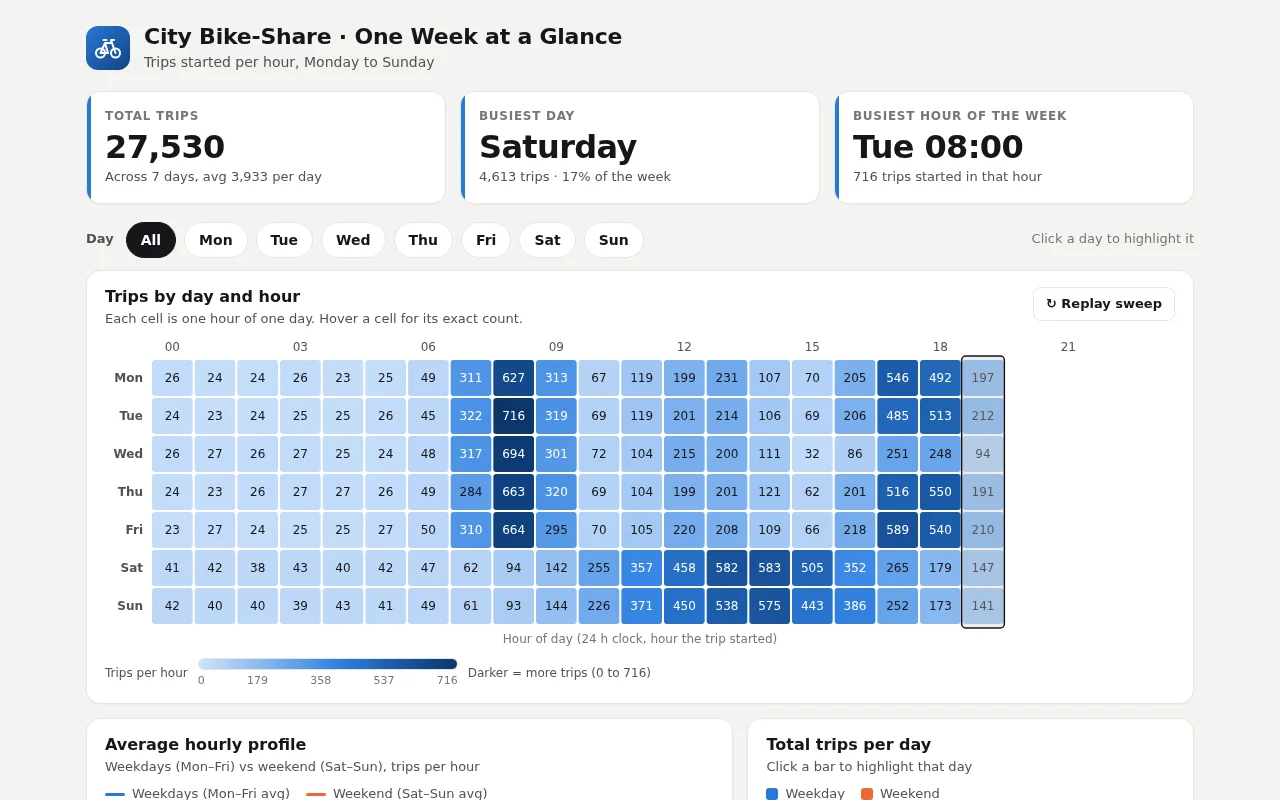
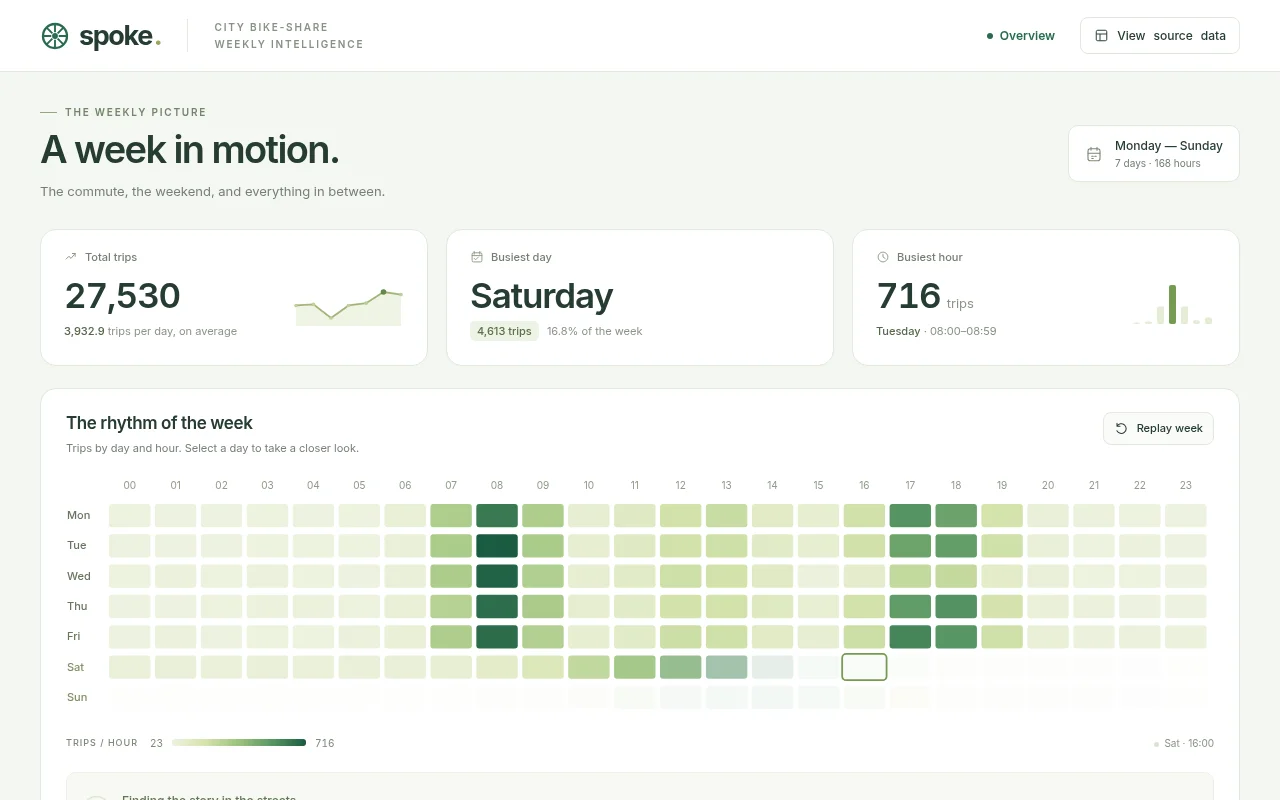
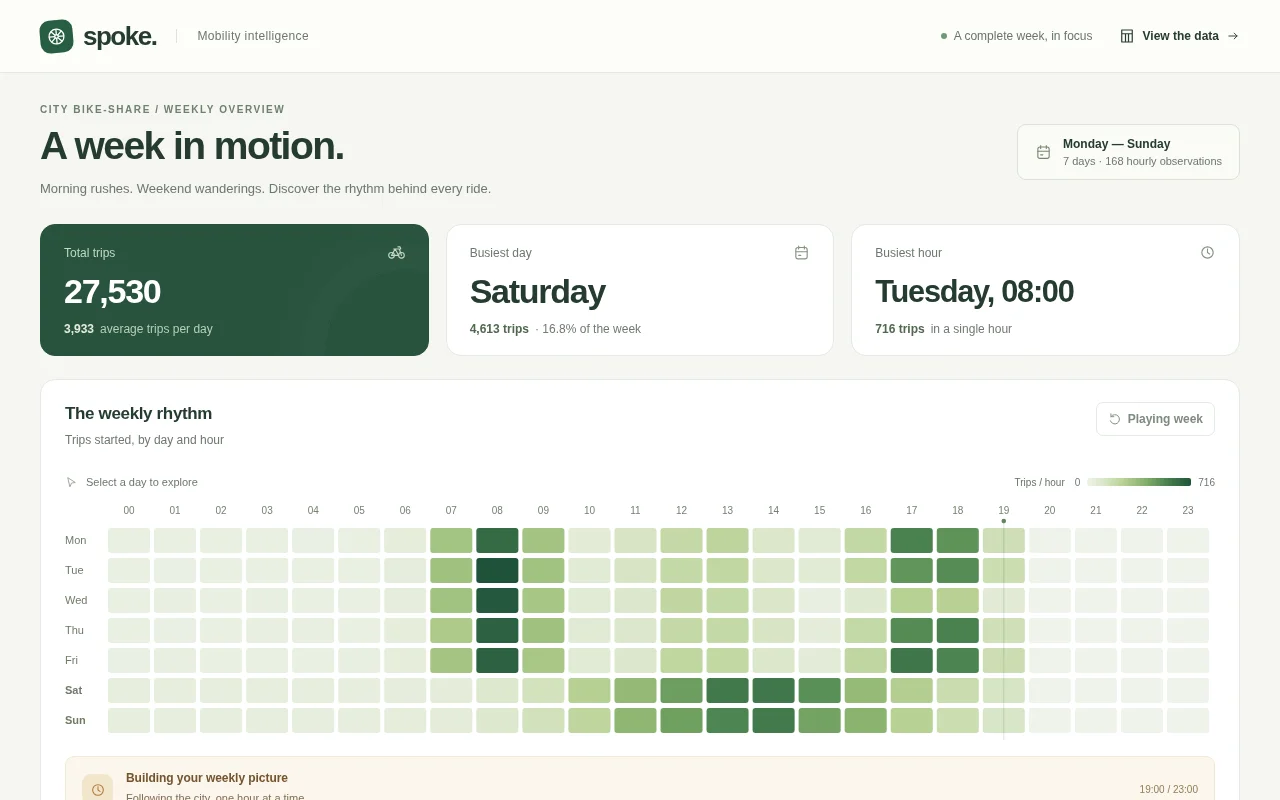
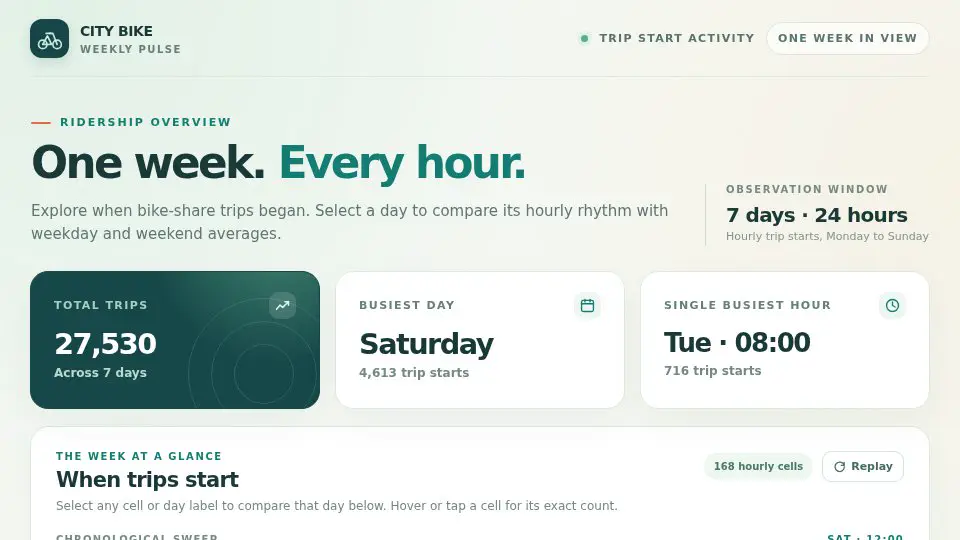
Build an interactive dashboard for one week of a city bike-share scheme from the exact dataset below (CSV: trips started per hour, one row per day, columns h00 to h23). Embed the data in the page verbatim and compute every number from it; do not invent or alter any value. day,h00,h01,h02,h03,h04,h05,h06,h07,h08,h09,h10,h11,h12,h13,h14,h15,h16,h17,h18,h19,h20,h21,h22,h23 Mon,26,24,24,26,23,25,49,311,627,313,67,119,199,231,107,70,205,546,492,197,45,27,25,24 Tue,24,23,24,25,25,26,45,322,716,319,69,119,201,214,106,69,206,485,513,212,48,25,27,23 Wed,26,27,26,27,25,24,48,317,694,301,72,104,215,200,111,32,86,251,248,94,45,26,26,23 Thu,24,23,26,27,27,26,49,284,663,320,69,104,199,201,121,62,201,516,550,191,46,27,23,24 Fri,23,27,24,25,25,27,50,310,664,295,70,105,220,208,109,66,218,589,540,210,51,27,30,28 Sat,41,42,38,43,40,42,47,62,94,142,255,357,458,582,583,505,352,265,179,147,125,101,64,49 Sun,42,40,40,39,43,41,49,61,93,144,226,371,450,538,575,443,386,252,173,141,111,86,66,47 The dashboard needs: a 7 x 24 heatmap (days by hours) with a clear colour legend; a line chart of the average hourly profile for weekdays versus the weekend; a bar chart of total trips per day; KPI cards for total trips, the busiest day, and the single busiest hour of the week (day and hour); and an automatic callout that spots the anomaly in the data (one weekday evening that is far below the other weekdays at the same hours) and names it. Clicking a day highlights that day's row in the heatmap and draws its hourly line over the profile chart; hovering any heatmap cell shows its exact count. Draw the charts yourself with SVG or Canvas. So the page is alive without input, on load the heatmap fills in hour by hour like a clock sweeping across the week (about 5 seconds), then the anomaly callout appears. Make it look like a polished product, readable on desktop and phone. Save it as index.html in the current directory: one self-contained file with inline CSS and JavaScript only, no libraries or frameworks, and no external requests of any kind (no CDNs, web fonts, images or audio files). It must work when opened directly from disk, fit any window from a 390 px wide phone to a desktop, and run without console errors. You may serve it locally and open it in headless chromium (/usr/bin/chromium, software WebGL, no GPU) to screenshot and inspect your own output, and iterate on your own before finishing. Close any browser you open as soon as you've taken your screenshot.
Claude Opus 5.5 Claude Code 2.1.280
Video: Recorded from the live demo
Open the live page in a new tab · Full result: prompt, transcript, cost and time
Claude Sonnet 5.5 Claude Code 2.1.280
Open the live page in a new tab · Full result: prompt, transcript, cost and time
GPT-6 Astra Codex CLI 0.156.1
Open the live page in a new tab · Full result: prompt, transcript, cost and time
GPT-6 Astra OpenCode 1.18.32
Open the live page in a new tab · Full result: prompt, transcript, cost and time
GPT-6 Sol Codex CLI 0.156.1
Open the live page in a new tab · Full result: prompt, transcript, cost and time
Coffee chain sales Test page · 5 finished of 5
The prompt (the same for every model)
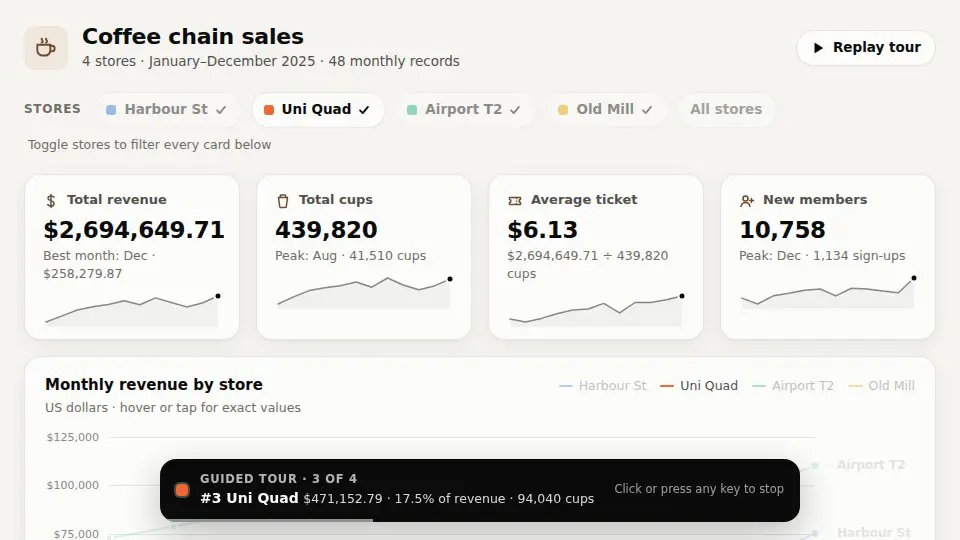
Build an interactive sales dashboard for a small coffee chain from the exact dataset below (CSV, 48 rows: 4 stores x 12 months of 2025). Embed the data in the page verbatim and compute every number from it; do not invent, round away or alter any value. month,store,cups,revenue_usd,new_members 2025-01,Harbour St,8620,48001.40,219 2025-01,Uni Quad,4670,22784.08,136 2025-01,Airport T2,9980,72817.87,285 2025-01,Old Mill,5140,26339.15,156 2025-02,Harbour St,8660,48132.70,179 2025-02,Uni Quad,7510,36583.14,176 2025-02,Airport T2,10710,78626.32,196 2025-02,Old Mill,5120,26783.20,145 2025-03,Harbour St,9600,53507.52,224 2025-03,Uni Quad,8140,40574.60,197 2025-03,Airport T2,11420,85142.33,222 2025-03,Old Mill,5980,31337.13,191 2025-04,Harbour St,9950,55661.36,280 2025-04,Uni Quad,8080,40043.67,147 2025-04,Airport T2,12350,92727.38,298 2025-04,Old Mill,6240,33325.28,151 2025-05,Harbour St,10520,61004.42,275 2025-05,Uni Quad,8460,41597.39,177 2025-05,Airport T2,12500,94954.01,301 2025-05,Old Mill,6130,32148.65,176 2025-06,Harbour St,10620,61721.59,313 2025-06,Uni Quad,9200,45959.02,213 2025-06,Airport T2,12750,96839.34,255 2025-06,Old Mill,6940,37380.48,168 2025-07,Harbour St,10960,63515.58,232 2025-07,Uni Quad,5610,28440.56,130 2025-07,Airport T2,13010,97534.46,267 2025-07,Old Mill,7310,39219.21,204 2025-08,Harbour St,11000,62556.63,252 2025-08,Uni Quad,9900,49592.99,265 2025-08,Airport T2,13860,104199.02,279 2025-08,Old Mill,6750,35505.26,164 2025-09,Harbour St,9960,56831.50,271 2025-09,Uni Quad,8750,44825.12,174 2025-09,Airport T2,12770,99211.32,301 2025-09,Old Mill,6520,35173.20,204 2025-10,Harbour St,9800,57724.32,231 2025-10,Uni Quad,8510,43550.50,222 2025-10,Airport T2,11410,88144.32,282 2025-10,Old Mill,5920,31946.68,180 2025-11,Harbour St,10260,59774.09,229 2025-11,Uni Quad,8660,44209.58,203 2025-11,Airport T2,12430,96807.87,266 2025-11,Old Mill,6160,33615.60,188 2025-12,Harbour St,12660,75310.44,360 2025-12,Uni Quad,6550,32992.14,188 2025-12,Airport T2,14490,110341.47,368 2025-12,Old Mill,7280,39635.82,218 The dashboard needs: KPI cards for total revenue, total cups, average ticket (revenue / cups) and total new members; a monthly revenue line chart with one line per store; a stacked bar chart of cups per quarter split by store; a ranking of stores by revenue; and a table of the raw rows that can be sorted by clicking any column header. Store filter toggles must update every KPI, chart and the table together. Hovering any chart point or bar shows a tooltip with its exact values. Format money as US dollars with thousands separators. Draw the charts yourself with SVG or Canvas. So the page is alive without input, it plays a short guided tour on load: it highlights each store in turn for about 2 seconds (dimming the others in every chart), then returns to all stores; any click or key press stops the tour. Make it look like a polished product, readable on desktop and phone. Save it as index.html in the current directory: one self-contained file with inline CSS and JavaScript only, no libraries or frameworks, and no external requests of any kind (no CDNs, web fonts, images or audio files). It must work when opened directly from disk, fit any window from a 390 px wide phone to a desktop, and run without console errors. You may serve it locally and open it in headless chromium (/usr/bin/chromium, software WebGL, no GPU) to screenshot and inspect your own output, and iterate on your own before finishing. Close any browser you open as soon as you've taken your screenshot.
Claude Opus 5.5 Claude Code 2.1.280
Video: Recorded from the live demo
Open the live page in a new tab · Full result: prompt, transcript, cost and time
Claude Sonnet 5.5 Claude Code 2.1.280
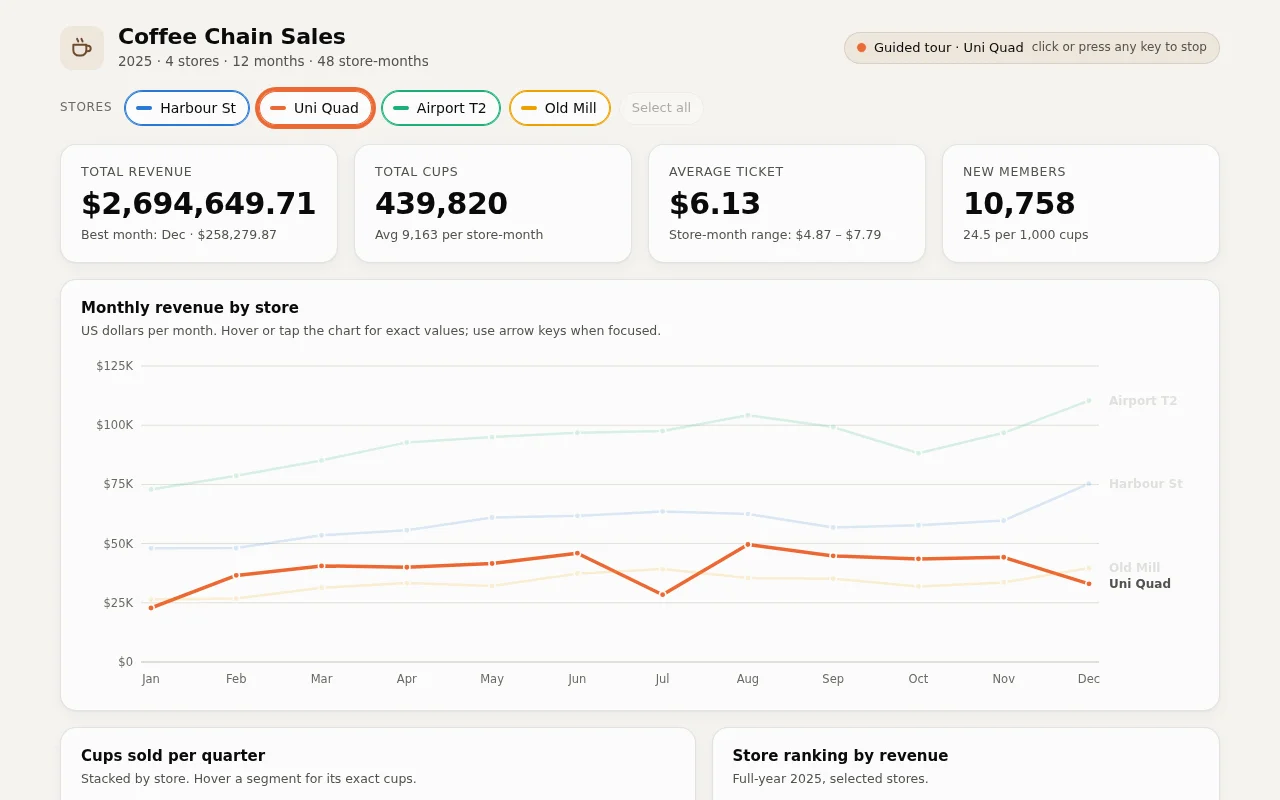
Open the live page in a new tab · Full result: prompt, transcript, cost and time
GPT-6 Astra Codex CLI 0.156.1
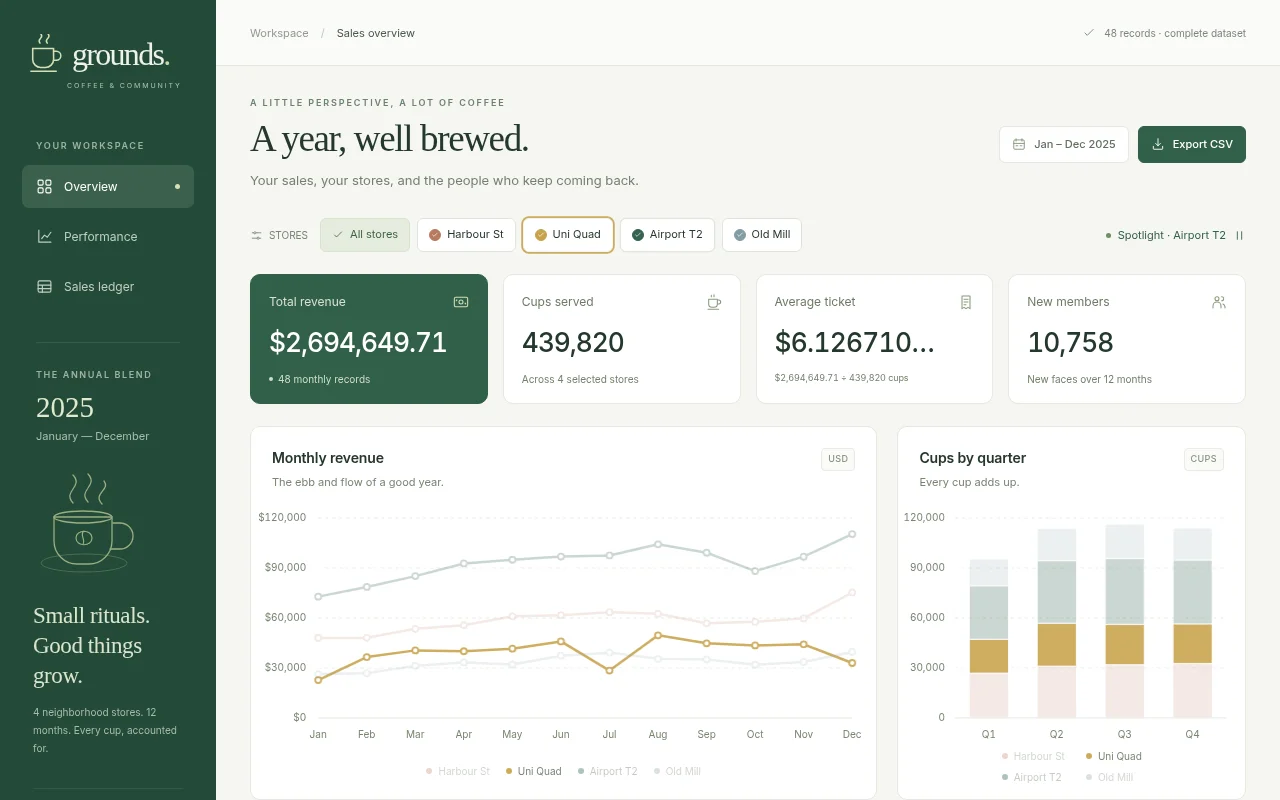
Open the live page in a new tab · Full result: prompt, transcript, cost and time
GPT-6 Astra OpenCode 1.18.32
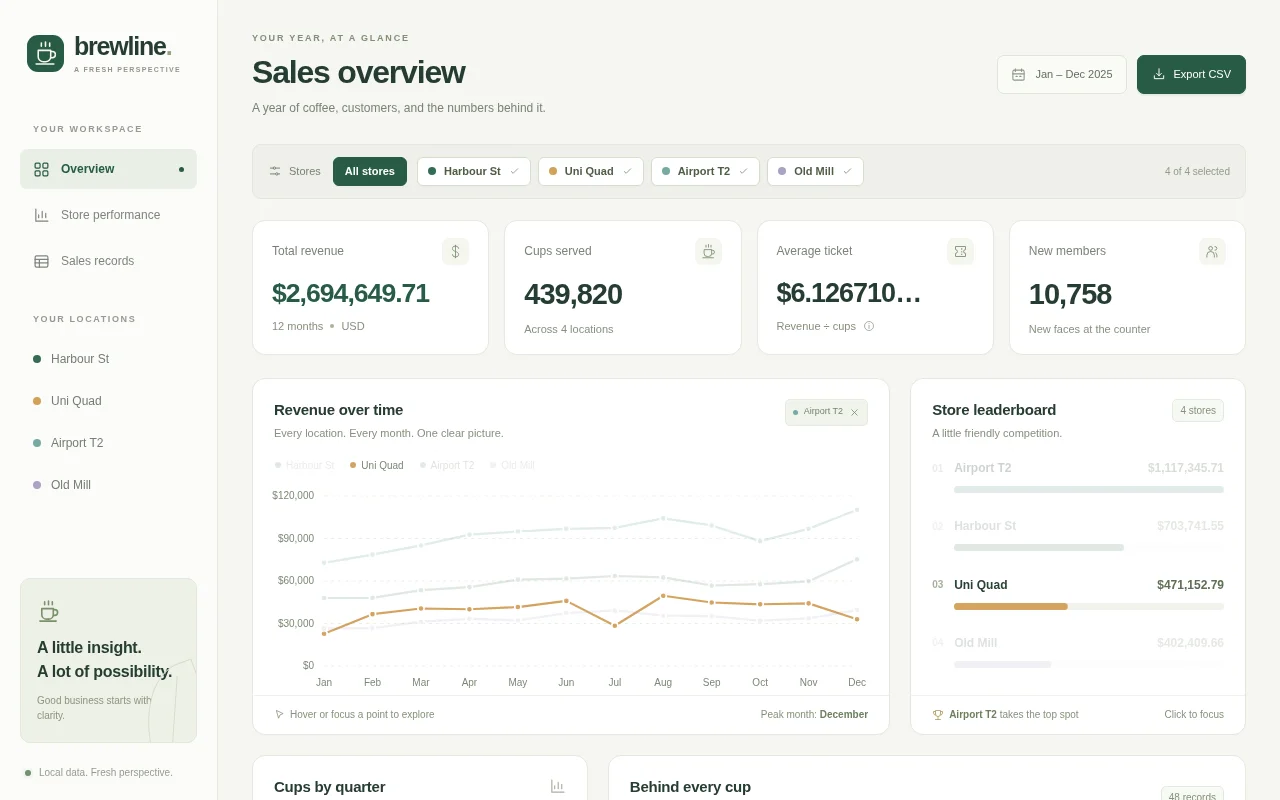
Open the live page in a new tab · Full result: prompt, transcript, cost and time
GPT-6 Sol Codex CLI 0.156.1
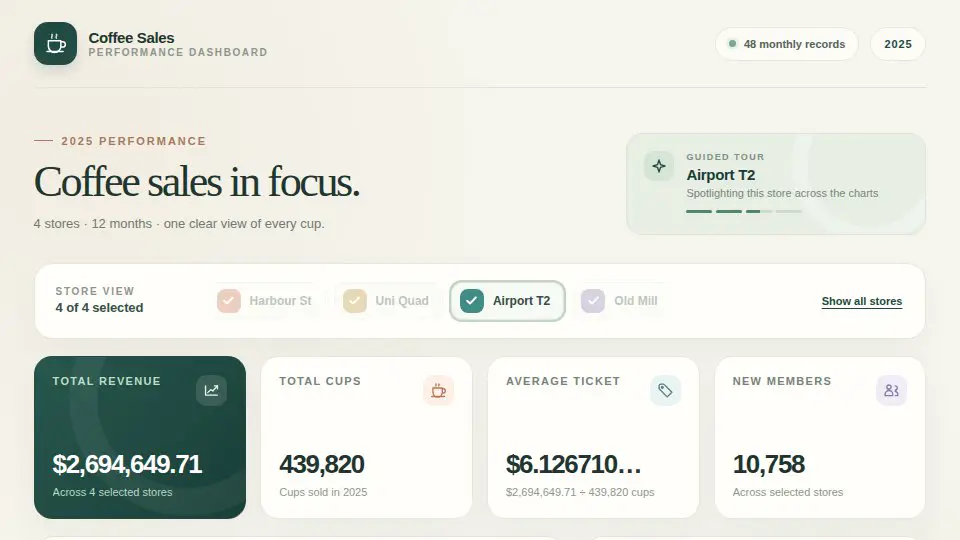
Open the live page in a new tab · Full result: prompt, transcript, cost and time
Ecommerce funnel Test page · 2 finished of 2
The prompt (the same for every model)
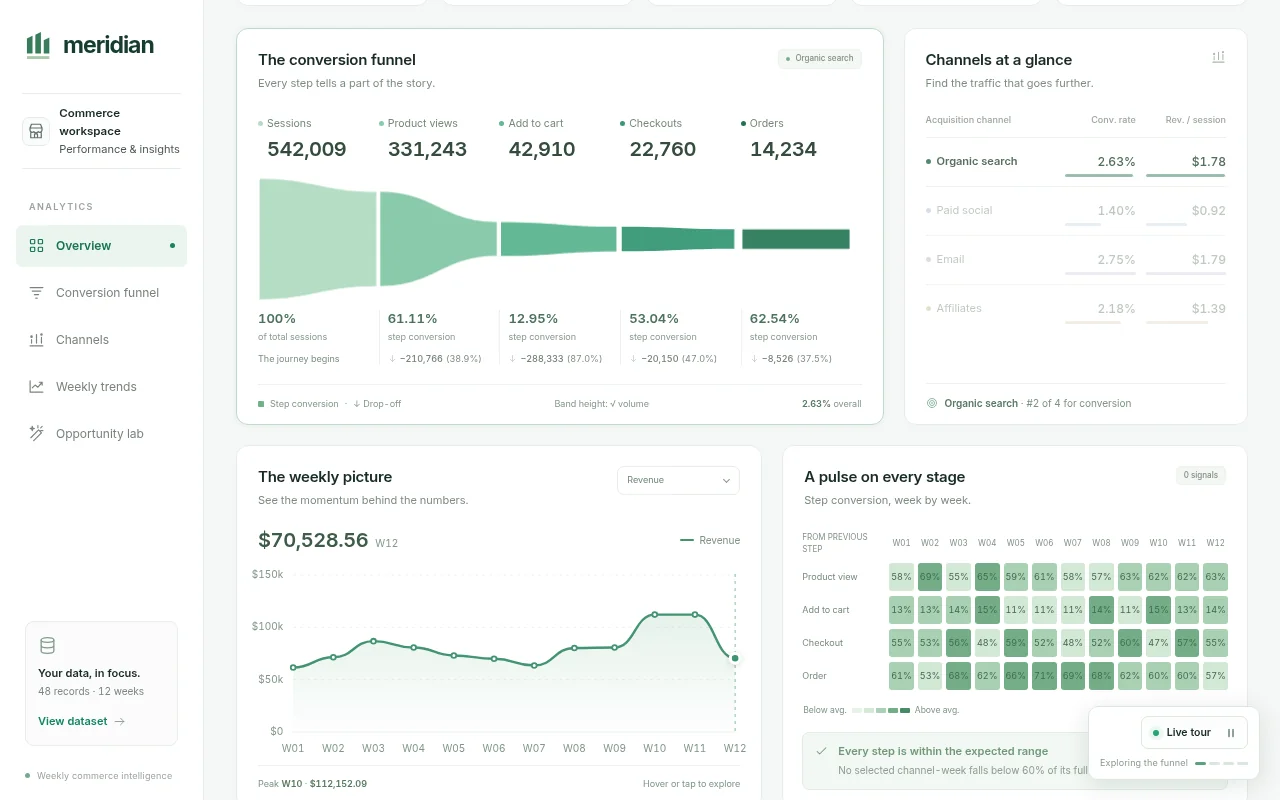
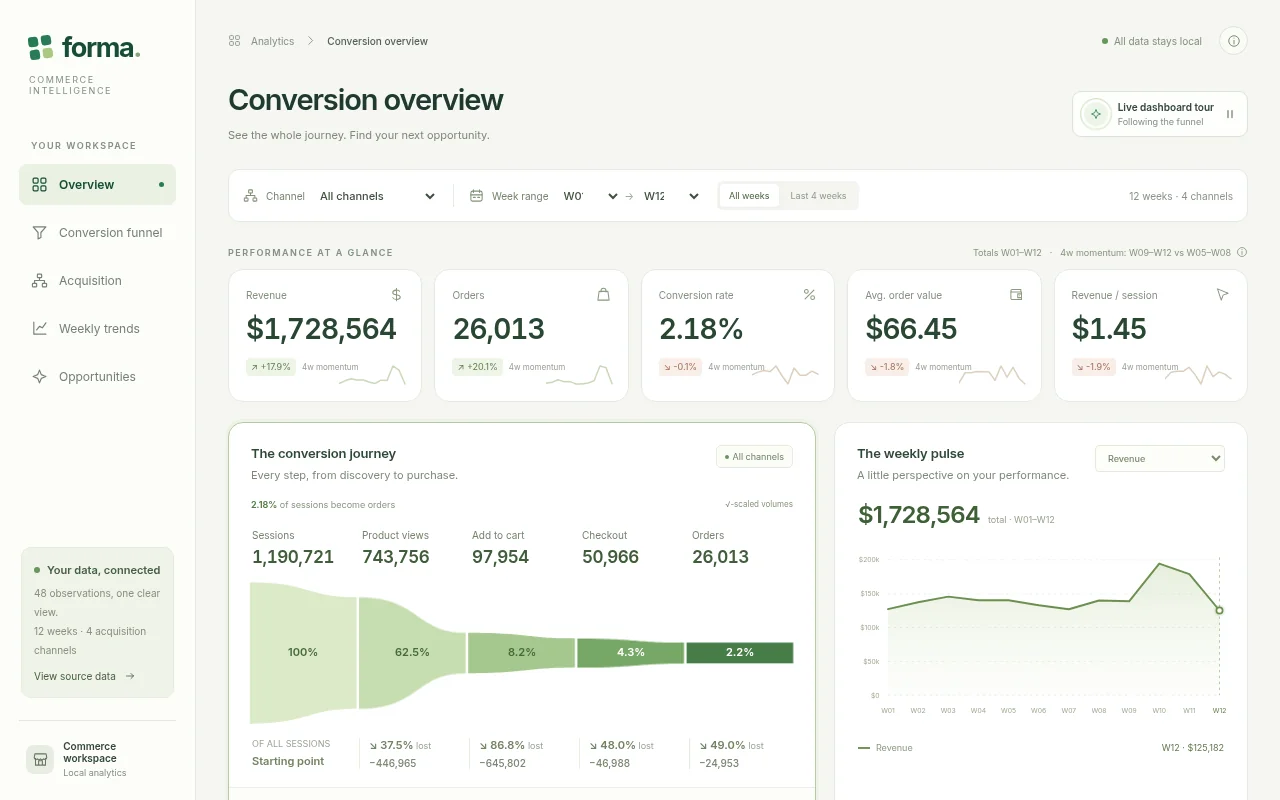
Build an interactive e-commerce conversion funnel dashboard from the exact dataset below (CSV: one row per week and acquisition channel with sessions, product views, add-to-cart events, checkouts started, orders and revenue in US dollars). Embed the data in the page verbatim and compute every number from it; do not invent or alter any value. week,channel,sessions,product_views,add_to_cart,checkout_started,orders,revenue_usd W01,Organic search,41078,23808,3022,1664,1007,61604.87 W01,Paid social,29553,16291,2453,1413,439,28577.0 W01,Email,9676,6212,765,421,263,17543.38 W01,Affiliates,12459,8376,1123,612,294,19534.46 W02,Organic search,39462,27334,3685,1940,1028,71414.28 W02,Paid social,30938,17683,2757,1524,410,27158.28 W02,Email,9600,6541,909,539,348,21743.58 W02,Affiliates,12881,8218,1003,504,263,17113.4 W03,Organic search,44423,24608,3329,1856,1259,86784.87 W03,Paid social,30858,18201,2214,1150,460,31397.77 W03,Email,9521,5537,625,323,201,12787.56 W03,Affiliates,12450,7220,807,369,252,14706.22 W04,Organic search,42148,27564,4059,1961,1211,80712.33 W04,Paid social,31643,21078,2811,1606,424,28675.25 W04,Email,8990,5420,621,300,186,12825.63 W04,Affiliates,11171,6965,891,459,260,18220.72 W05,Organic search,40552,24076,2693,1602,1065,73137.37 W05,Paid social,27957,19064,2258,1166,380,22865.57 W05,Email,8419,5117,768,458,333,23433.12 W05,Affiliates,13002,8405,991,519,305,21023.72 W06,Organic search,41353,25171,2806,1464,1037,69935.08 W06,Paid social,31261,20635,2962,1610,478,34375.73 W06,Email,8785,5180,602,350,243,14675.03 W06,Affiliates,10876,6911,846,419,217,13958.06 W07,Organic search,45923,26492,2996,1453,1009,63590.97 W07,Paid social,30650,19483,2477,545,397,24507.5 W07,Email,9762,5572,885,427,274,19092.88 W07,Affiliates,12569,8516,1339,607,290,19871.0 W08,Organic search,39257,22508,3067,1608,1090,80304.82 W08,Paid social,27396,18815,2887,1521,370,24924.69 W08,Email,8732,4905,694,357,256,16113.52 W08,Affiliates,12974,7423,871,490,300,18588.38 W09,Organic search,43769,27584,3167,1885,1164,80776.52 W09,Paid social,32979,21507,2954,1761,474,29511.87 W09,Email,9766,5958,740,349,222,13038.74 W09,Affiliates,11969,7534,986,487,256,15410.29 W10,Organic search,62108,38464,5685,2645,1591,112152.09 W10,Paid social,43357,28900,4203,2065,628,42320.58 W10,Email,9833,5660,688,400,279,19964.74 W10,Affiliates,15861,10838,1246,663,324,20077.73 W11,Organic search,61607,38179,4958,2802,1692,112147.42 W11,Paid social,36623,25030,3720,1756,497,33026.25 W11,Email,9552,5336,669,369,239,14580.06 W11,Affiliates,15696,10500,1268,676,317,19178.7 W12,Organic search,40329,25455,3443,1880,1081,70528.56 W12,Paid social,29585,20344,2424,1159,401,24455.8 W12,Email,8312,5695,677,330,203,12879.42 W12,Affiliates,13056,7443,910,502,296,17318.13 The dashboard needs: an animated funnel chart (sessions to orders) with the drop-off at every stage as a count and a percentage; KPI cards for revenue, orders, conversion rate, average order value and revenue per session, each with its change versus the previous four weeks; a channel comparison of conversion rate and revenue per session; a weekly trend chart with a metric switcher; a stage-by-week heatmap of step conversion rates that makes anomalies obvious, with any week where a step rate falls below 60 percent of its channel average flagged and explained; a what-if panel with sliders to lift each stage's conversion and see projected orders and revenue; filters by channel and week range that update everything; and hover or tap tooltips with exact values. Make it sharp, modern and executive-ready. So the page is alive without input, on load the funnel pours in stage by stage and a tour cycles forever: it switches channels on the funnel, steps through the weeks on the trend chart, flags the anomaly on the heatmap, and moves the what-if sliders to show the projection, until the user touches a control. Save it as index.html in the current directory: one self-contained file with inline CSS and JavaScript only, no libraries or frameworks, and no external requests of any kind (no CDNs, web fonts, images or audio files). It must work when opened directly from disk, fit any window from a 390 px wide phone to a desktop, and run without console errors. You may serve it locally and open it in headless chromium (/usr/bin/chromium, software WebGL, no GPU) to screenshot and inspect your own output, and iterate on your own before finishing. Close any browser you open as soon as you've taken your screenshot.
Power grid day Test page · 3 finished of 3
The prompt (the same for every model)
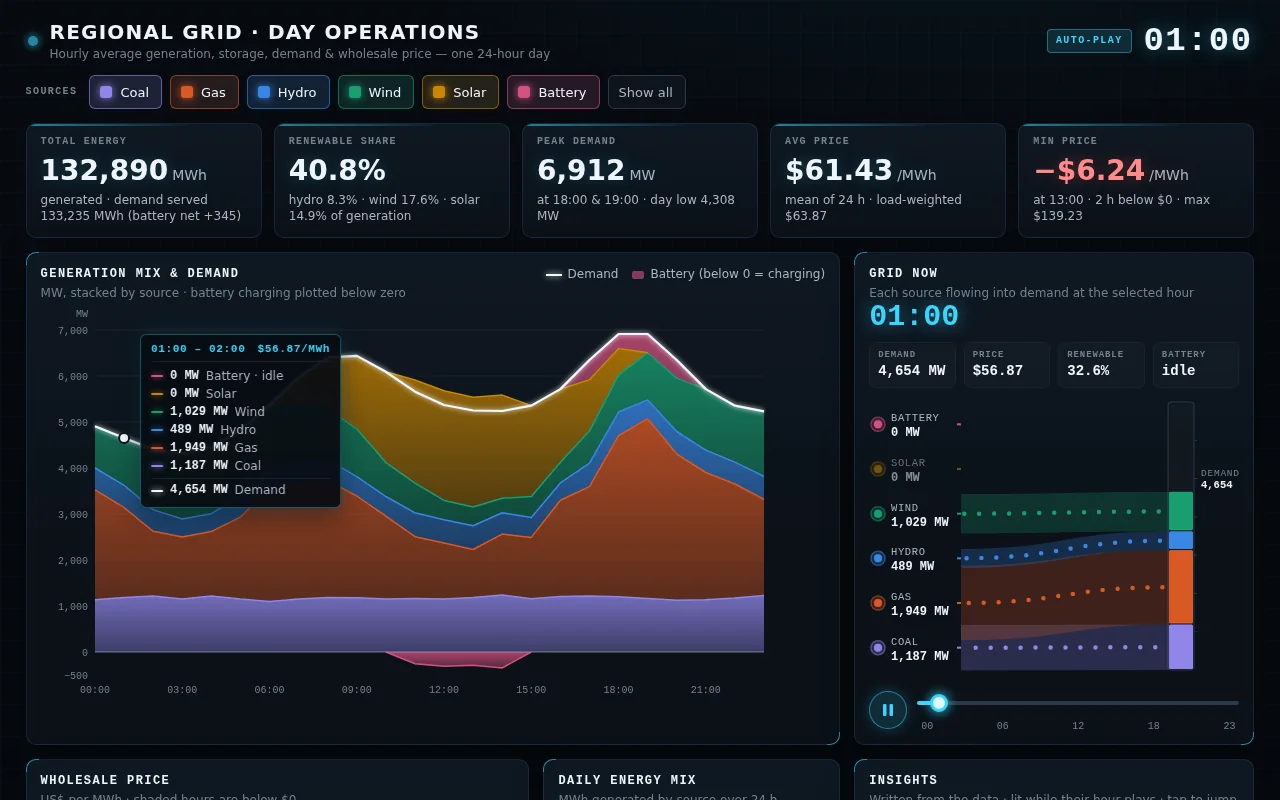
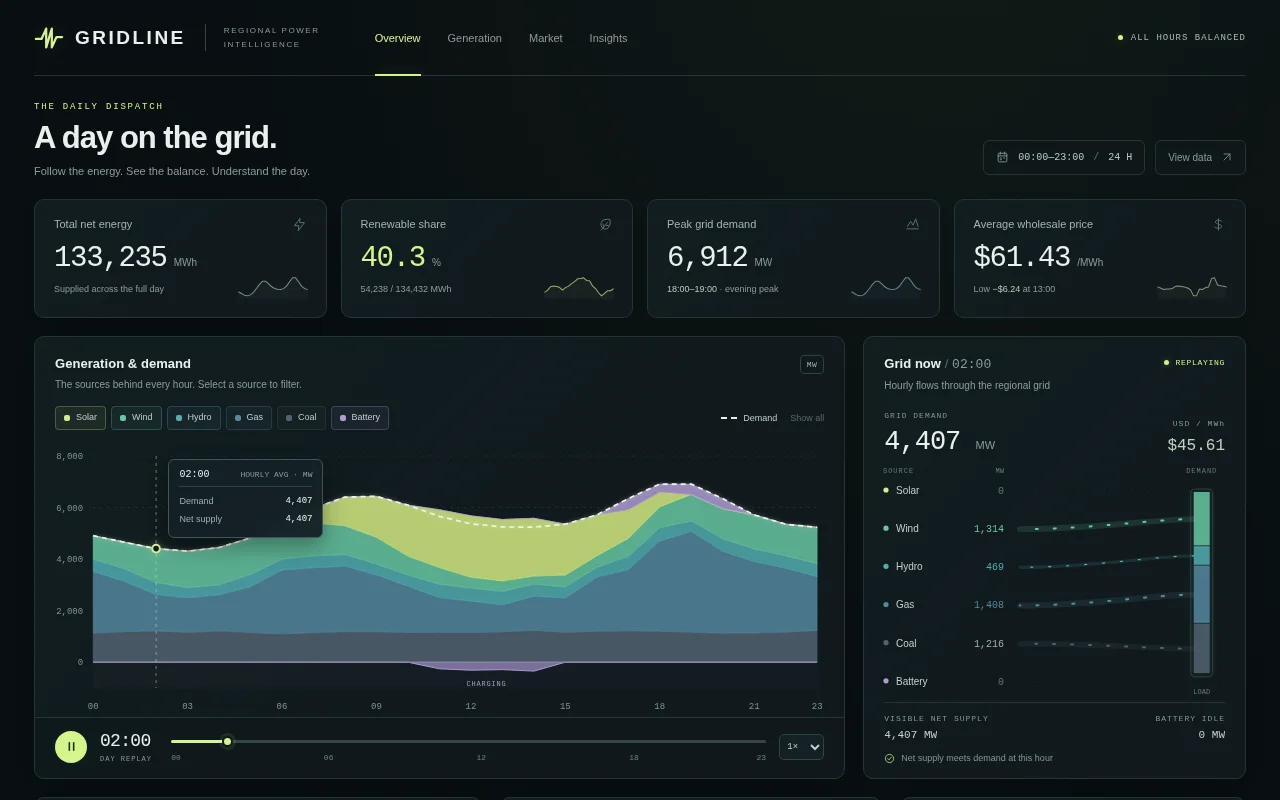
Build an interactive electricity grid dashboard for one day on a regional power grid from the exact dataset below (CSV: hourly average generation by source in megawatts, battery output where negative values mean the batteries are charging, total demand, and the wholesale price in US dollars per megawatt-hour). Embed the data in the page verbatim and compute every number from it; do not invent or alter any value. hour,solar_mw,wind_mw,hydro_mw,gas_mw,coal_mw,battery_mw,demand_mw,price_usd_mwh 00:00,0,908,477,2389,1134,0,4908,66.39 01:00,0,1029,489,1949,1187,0,4654,56.87 02:00,0,1314,469,1408,1216,0,4407,45.61 03:00,0,1416,389,1348,1155,0,4308,48.33 04:00,0,1444,389,1400,1217,0,4450,50.12 05:00,0,1420,472,1781,1150,0,4823,53.61 06:00,0,1364,425,2478,1100,0,5367,70.84 07:00,574,1275,457,2517,1149,0,5972,72.42 08:00,1115,1114,449,2543,1186,0,6407,69.67 09:00,1591,1034,421,2210,1181,0,6437,65.77 10:00,1975,737,428,1798,1154,0,6092,57.38 11:00,2244,644,520,1345,1161,-256,5658,43.57 12:00,2383,422,503,1220,1150,-309,5369,-5.25 13:00,2383,407,517,1047,1182,-287,5249,-6.24 14:00,2244,313,465,1324,1239,-345,5240,48.61 15:00,1975,459,430,1334,1158,0,5356,44.95 16:00,1591,448,380,2092,1205,0,5716,60.08 17:00,1115,697,510,2375,1220,431,6348,65.74 18:00,574,809,515,3503,1199,312,6912,133.18 19:00,0,1027,408,3908,1164,405,6912,139.23 20:00,0,1161,491,3178,1124,394,6348,82.08 21:00,0,1326,487,2768,1135,0,5716,74.8 22:00,0,1226,477,2481,1171,0,5355,71.86 23:00,0,1411,501,2088,1231,0,5231,64.7 The dashboard needs: a stacked area chart of the generation mix over the 24 hours with demand drawn as a line on top and battery charging shown below the zero axis; KPI cards for total energy in MWh, renewable share of generation, peak demand and its hour, and the daily average and minimum price; a price line chart with negative-price hours shaded and labelled; a donut of the daily energy mix by source; a live 'grid now' panel driven by an hour scrubber that shows each source as an animated flow into the demand bar; source toggles that update every chart; hover or tap tooltips with exact values; and a short auto-written insights panel computed from the data (for example when solar exceeded half of demand, when batteries charged and discharged). Style it like a control-room display: dark, precise, glowing. So the page is alive without input, on load the charts draw in and the hour scrubber plays through the day on a loop with the flow panel animating, tooltips following the playhead and the insights highlighting as their hours pass, forever, until the user touches a control. Save it as index.html in the current directory: one self-contained file with inline CSS and JavaScript only, no libraries or frameworks, and no external requests of any kind (no CDNs, web fonts, images or audio files). It must work when opened directly from disk, fit any window from a 390 px wide phone to a desktop, and run without console errors. You may serve it locally and open it in headless chromium (/usr/bin/chromium, software WebGL, no GPU) to screenshot and inspect your own output, and iterate on your own before finishing. Close any browser you open as soon as you've taken your screenshot.
Claude Opus 5.5 Claude Code 2.1.280
Open the live page in a new tab · Full result: prompt, transcript, cost and time
GPT-6 Astra Codex CLI 0.156.1
Open the live page in a new tab · Full result: prompt, transcript, cost and time
GPT-6 Astra OpenCode 1.18.32
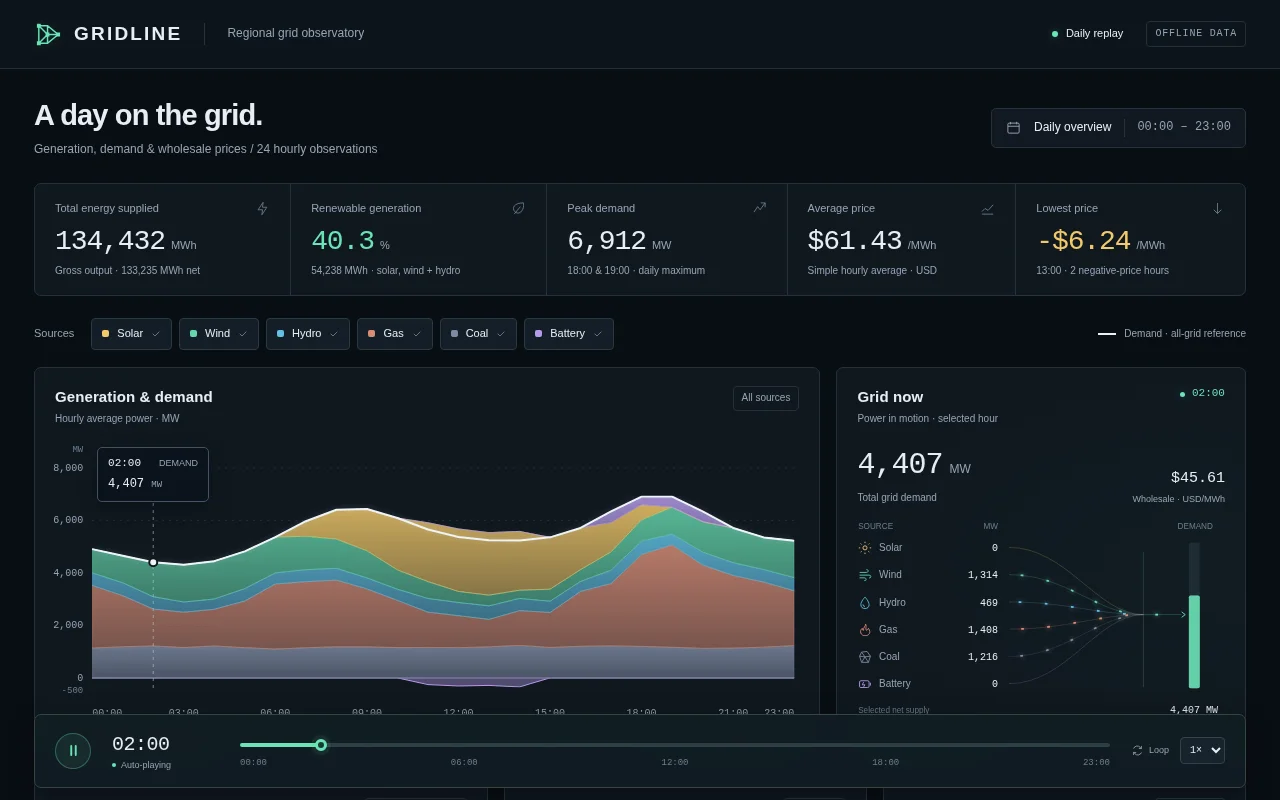
Open the live page in a new tab · Full result: prompt, transcript, cost and time
Saas growth metrics Test page · 3 finished of 4
The prompt (the same for every model)
Build an interactive SaaS growth dashboard from the exact dataset below (CSV: one row per month and plan with customers at the start of the month, new and churned customers during it, and the monthly list price per customer in US dollars). Embed the data in the page verbatim and compute every number from it; do not invent or alter any value. Ending customers = customers_start + new_customers - churned_customers, and MRR = ending customers x price_usd. month,plan,customers_start,new_customers,churned_customers,price_usd 2025-05,Starter,220,36,15,19 2025-05,Team,90,10,3,79 2025-05,Enterprise,12,3,0,499 2025-06,Starter,241,39,15,19 2025-06,Team,97,12,3,79 2025-06,Enterprise,15,1,1,499 2025-07,Starter,265,46,16,19 2025-07,Team,106,9,4,79 2025-07,Enterprise,15,1,0,499 2025-08,Starter,295,33,24,19 2025-08,Team,111,18,3,79 2025-08,Enterprise,16,2,0,499 2025-09,Starter,304,29,18,19 2025-09,Team,126,13,4,79 2025-09,Enterprise,18,3,0,499 2025-10,Starter,315,47,23,19 2025-10,Team,135,16,6,79 2025-10,Enterprise,21,2,1,499 2025-11,Starter,339,36,20,19 2025-11,Team,145,13,4,79 2025-11,Enterprise,22,3,0,499 2025-12,Starter,355,45,25,19 2025-12,Team,154,17,6,79 2025-12,Enterprise,25,0,0,499 2026-01,Starter,375,38,26,19 2026-01,Team,165,16,4,79 2026-01,Enterprise,25,2,0,499 2026-02,Starter,387,28,31,19 2026-02,Team,177,15,25,79 2026-02,Enterprise,27,1,0,499 2026-03,Starter,384,31,25,19 2026-03,Team,167,17,5,79 2026-03,Enterprise,28,2,1,499 2026-04,Starter,390,29,20,19 2026-04,Team,179,9,6,89 2026-04,Enterprise,29,1,0,549 2026-05,Starter,399,32,34,19 2026-05,Team,182,16,6,89 2026-05,Enterprise,30,2,0,549 2026-06,Starter,397,30,33,19 2026-06,Team,192,12,8,89 2026-06,Enterprise,32,0,1,549 2026-07,Starter,394,43,27,19 2026-07,Team,196,15,8,89 2026-07,Enterprise,31,0,1,549 2026-08,Starter,410,41,28,19 2026-08,Team,203,17,7,89 2026-08,Enterprise,30,0,0,549 2026-09,Starter,423,43,35,19 2026-09,Team,213,15,5,89 2026-09,Enterprise,30,2,0,549 2026-10,Starter,431,28,25,19 2026-10,Team,223,19,7,89 2026-10,Enterprise,32,3,1,549 The dashboard needs: KPI cards for current MRR, MRR growth over the period, current customers, average monthly logo churn rate and net revenue retention estimate; a stacked area chart of MRR by plan over time; a waterfall chart that decomposes the most recent month's MRR change into new, churned and price-change effects; a churn-rate line per plan with any month above twice its plan's average flagged and explained in an annotation; a cohort-style table of customers by plan and month with heat colouring; plan and date-range filters that update every chart; hover or tap tooltips with exact values; and a short auto-written insights panel (three sentences) computed from the data, such as which plan drives growth and when prices changed. Use a refined, modern product-analytics look. So the page is alive without input, on load the charts animate in and then a guided tour cycles forever: it highlights each KPI, steps a cursor through the months on the area chart with live tooltips, rebuilds the waterfall, applies and clears a plan filter, and points out the churn anomaly, until the user touches a control. Save it as index.html in the current directory: one self-contained file with inline CSS and JavaScript only, no libraries or frameworks, and no external requests of any kind (no CDNs, web fonts, images or audio files). It must work when opened directly from disk, fit any window from a 390 px wide phone to a desktop, and run without console errors. You may serve it locally and open it in headless chromium (/usr/bin/chromium, software WebGL, no GPU) to screenshot and inspect your own output, and iterate on your own before finishing. Close any browser you open as soon as you've taken your screenshot.
Claude Opus 5.5 Claude Code 2.1.280
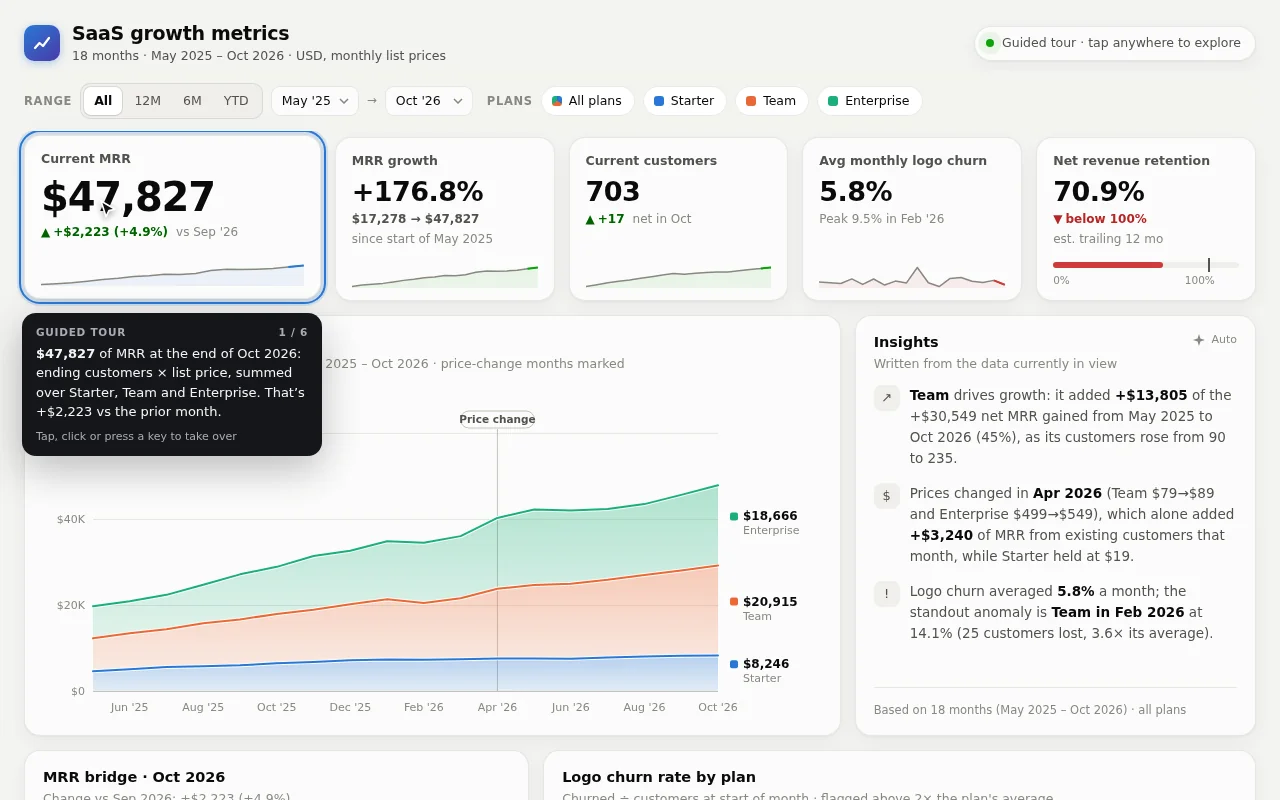
Open the live page in a new tab · Full result: prompt, transcript, cost and time
GPT-6 Astra Codex CLI 0.156.1
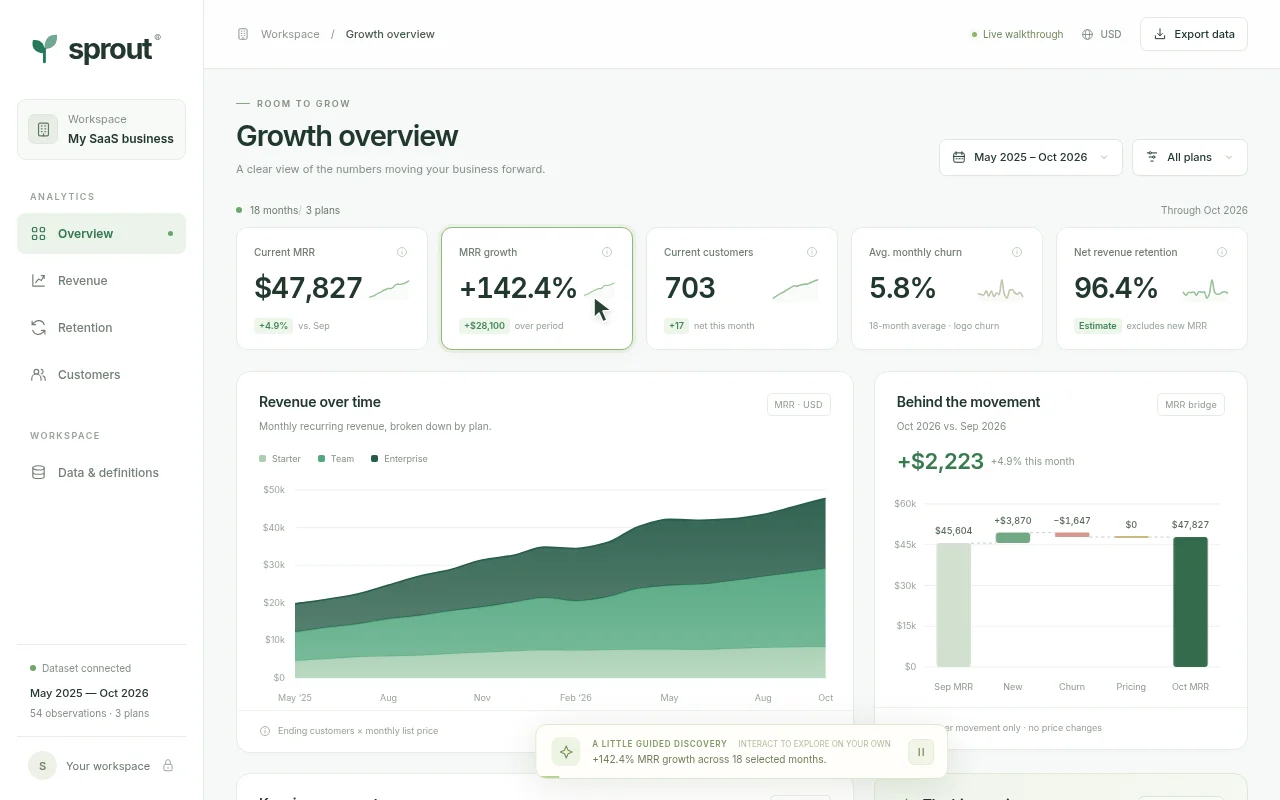
Open the live page in a new tab · Full result: prompt, transcript, cost and time
GPT-6 Astra OpenCode 1.18.32
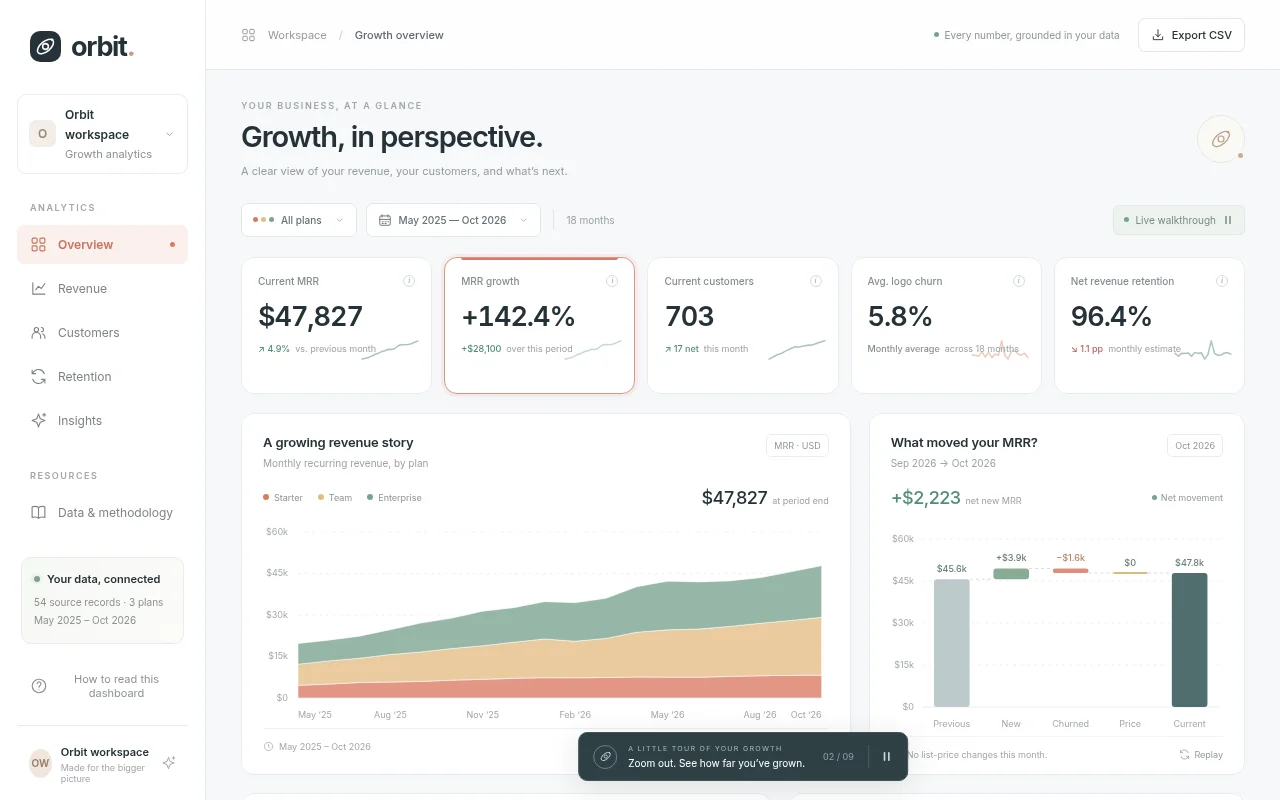
Open the live page in a new tab · Full result: prompt, transcript, cost and time
Claude Opus 5.5 OpenCode 1.18.32
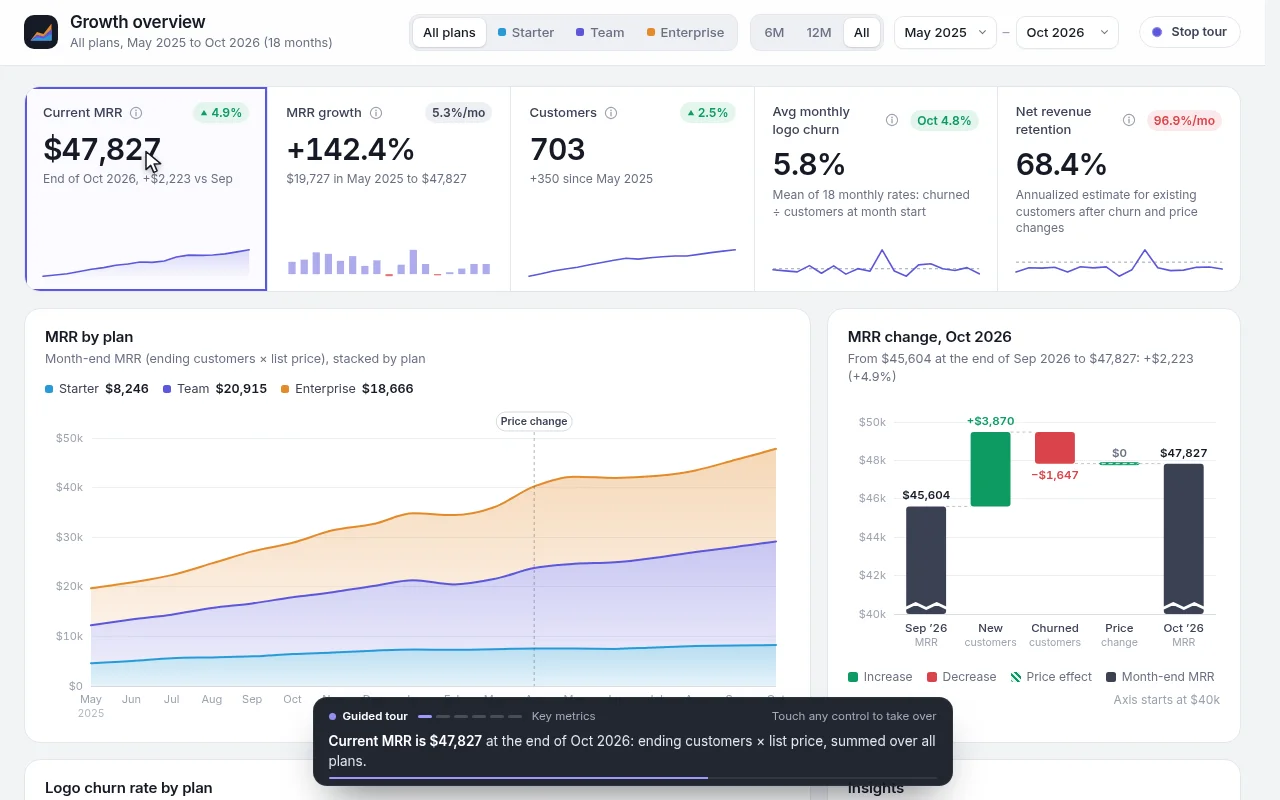
Failed · Stopped by us
World weather stations Test page · 3 finished of 3
The prompt (the same for every model)
Build an interactive climate dashboard comparing six weather stations from the exact dataset below (CSV: one row per city and month with the average daily high temperature in Celsius, total rainfall in millimetres and sunshine hours). Embed the data in the page verbatim and compute every number from it; do not invent or alter any value. city,month,avg_high_c,rain_mm,sun_hours Reykjavik,Jan,0.4,77,54 Reykjavik,Feb,0.9,76,81 Reykjavik,Mar,3.8,67,116 Reykjavik,Apr,6.3,48,147 Reykjavik,May,10.1,32,221 Reykjavik,Jun,12.9,24,247 Reykjavik,Jul,13.2,24,274 Reykjavik,Aug,12.2,29,233 Reykjavik,Sep,9.9,37,214 Reykjavik,Oct,6.2,51,160 Reykjavik,Nov,3.1,59,103 Reykjavik,Dec,2.6,74,77 Lisbon,Jan,13.3,100,52 Lisbon,Feb,14.1,99,77 Lisbon,Mar,18.5,69,113 Lisbon,Apr,20.3,47,168 Lisbon,May,25.3,31,222 Lisbon,Jun,27.9,15,245 Lisbon,Jul,28.5,1,259 Lisbon,Aug,27.6,5,259 Lisbon,Sep,24.3,21,212 Lisbon,Oct,21.1,51,146 Lisbon,Nov,18.0,83,100 Lisbon,Dec,15.4,89,84 Singapore,Jan,29.6,254,152 Singapore,Feb,30.6,249,136 Singapore,Mar,30.4,223,151 Singapore,Apr,31.4,201,174 Singapore,May,31.6,183,132 Singapore,Jun,30.9,158,155 Singapore,Jul,31.8,164,167 Singapore,Aug,31.0,163,160 Singapore,Sep,30.8,182,130 Singapore,Oct,31.9,203,172 Singapore,Nov,30.7,235,129 Singapore,Dec,29.9,237,146 Denver,Jan,5.9,47,63 Denver,Feb,7.5,42,76 Denver,Mar,11.6,41,101 Denver,Apr,18.0,40,160 Denver,May,24.9,27,219 Denver,Jun,30.0,23,251 Denver,Jul,30.7,22,253 Denver,Aug,29.4,25,241 Denver,Sep,24.9,38,201 Denver,Oct,17.6,29,153 Denver,Nov,12.2,33,106 Denver,Dec,7.4,35,64 Cape Town,Jan,27.6,9,269 Cape Town,Feb,25.9,16,279 Cape Town,Mar,24.9,30,236 Cape Town,Apr,23.3,60,192 Cape Town,May,21.0,68,142 Cape Town,Jun,18.1,87,111 Cape Town,Jul,17.8,94,111 Cape Town,Aug,18.8,79,131 Cape Town,Sep,20.3,69,163 Cape Town,Oct,22.7,46,187 Cape Town,Nov,24.4,35,227 Cape Town,Dec,25.9,16,280 Mumbai,Jan,30.2,7,62 Mumbai,Feb,30.0,6,68 Mumbai,Mar,29.9,11,121 Mumbai,Apr,32.1,79,166 Mumbai,May,33.0,247,205 Mumbai,Jun,33.0,481,245 Mumbai,Jul,33.2,601,273 Mumbai,Aug,32.3,494,241 Mumbai,Sep,32.5,252,225 Mumbai,Oct,31.5,67,166 Mumbai,Nov,29.8,3,115 Mumbai,Dec,30.1,7,81 The dashboard needs: small-multiple climate charts, one per city, each with monthly temperature as a line over rainfall as bars and the two axes clearly labelled; a radial (polar) chart of the selected city's year with temperature as radius and rainfall as colour; a heatmap of temperature by city and month; KPI cards per city for annual rainfall, hottest and coldest month, temperature range and total sunshine; a 'best month to visit' calculator with sliders for preferred temperature range, maximum rain and minimum sunshine that scores every city-month and lists the top five; a Celsius and Fahrenheit toggle; hover or tap tooltips with exact values; and a short auto-written comparison panel computed from the data. Make it beautiful, editorial and calm, like a data feature in a great magazine. So the page is alive without input, on load the charts draw in and a tour cycles forever: it rotates the radial chart through each city, sweeps a highlight across the heatmap month by month, adjusts the visit calculator sliders to show the ranking change, and toggles units once per loop, until the user touches a control. Save it as index.html in the current directory: one self-contained file with inline CSS and JavaScript only, no libraries or frameworks, and no external requests of any kind (no CDNs, web fonts, images or audio files). It must work when opened directly from disk, fit any window from a 390 px wide phone to a desktop, and run without console errors. You may serve it locally and open it in headless chromium (/usr/bin/chromium, software WebGL, no GPU) to screenshot and inspect your own output, and iterate on your own before finishing. Close any browser you open as soon as you've taken your screenshot.
Claude Opus 5.5 Claude Code 2.1.280
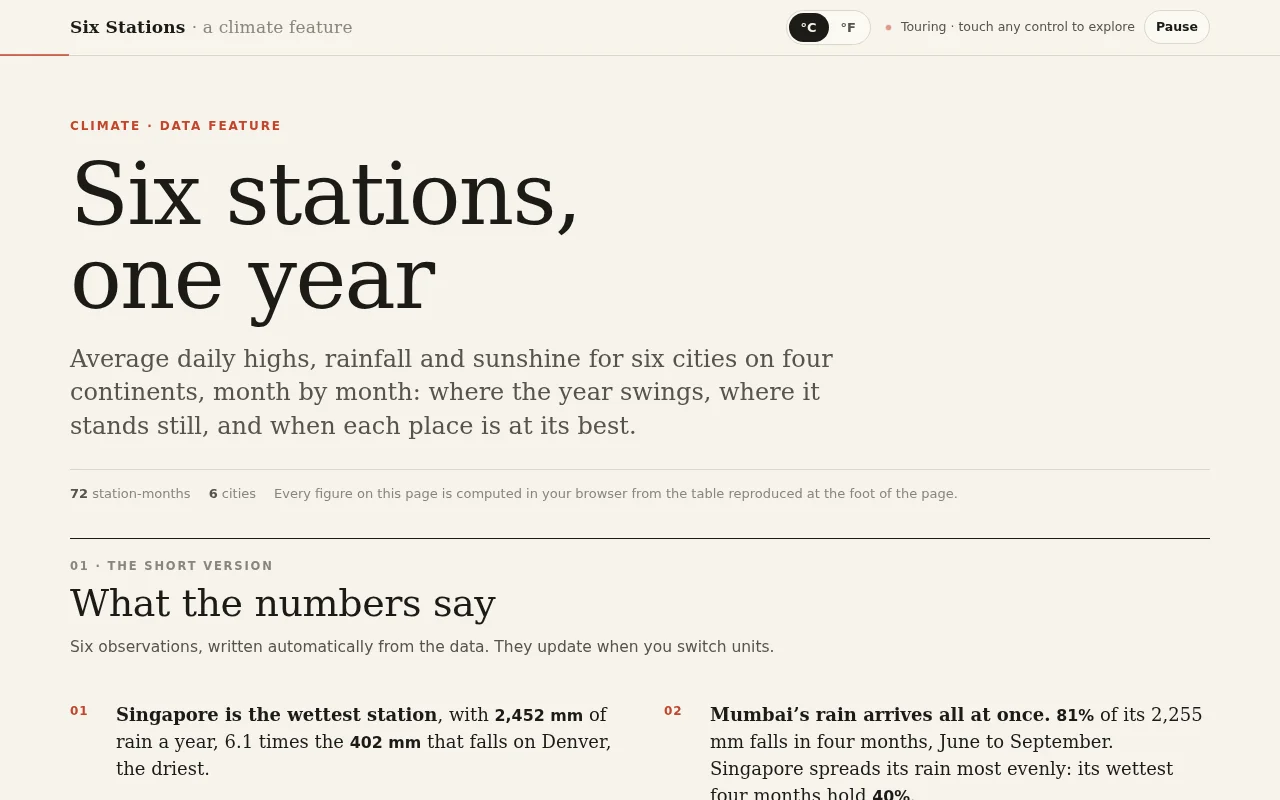
Open the live page in a new tab · Full result: prompt, transcript, cost and time
GPT-6 Astra Codex CLI 0.156.1
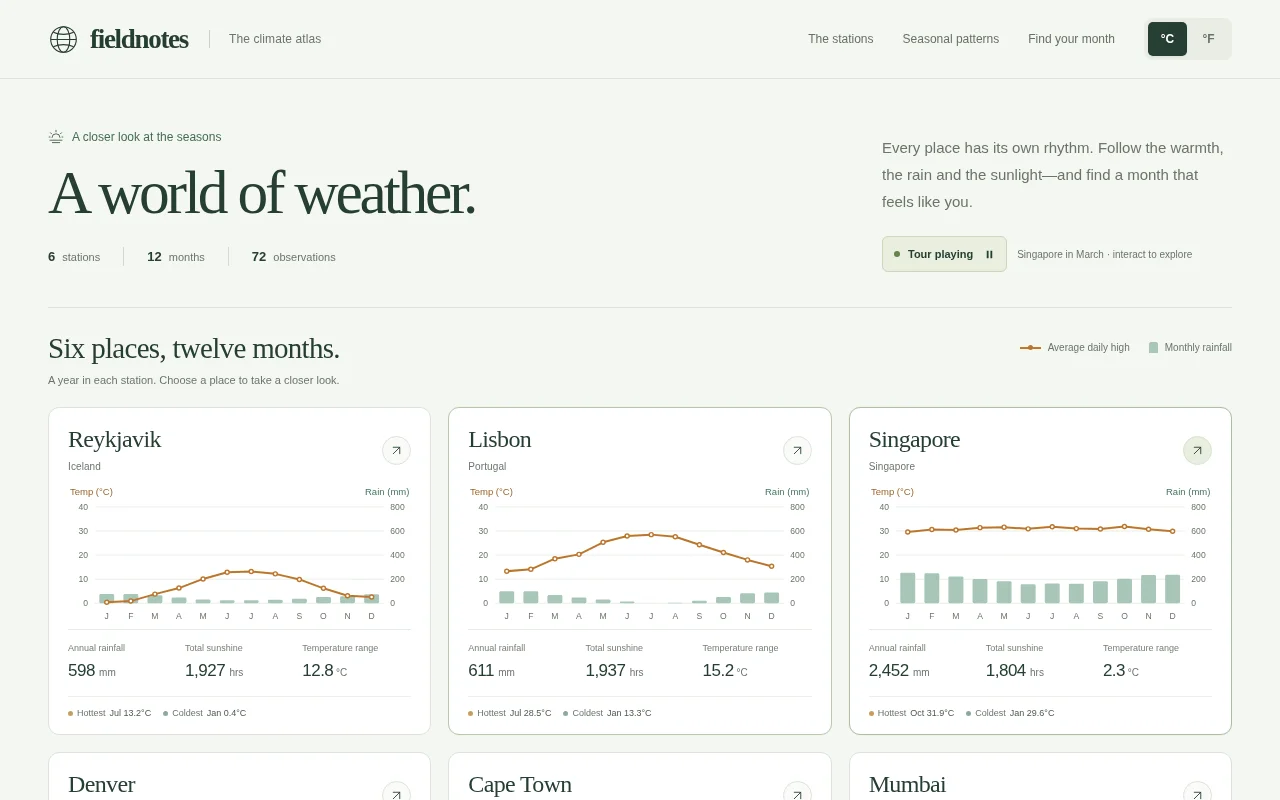
Open the live page in a new tab · Full result: prompt, transcript, cost and time
GPT-6 Astra OpenCode 1.18.32
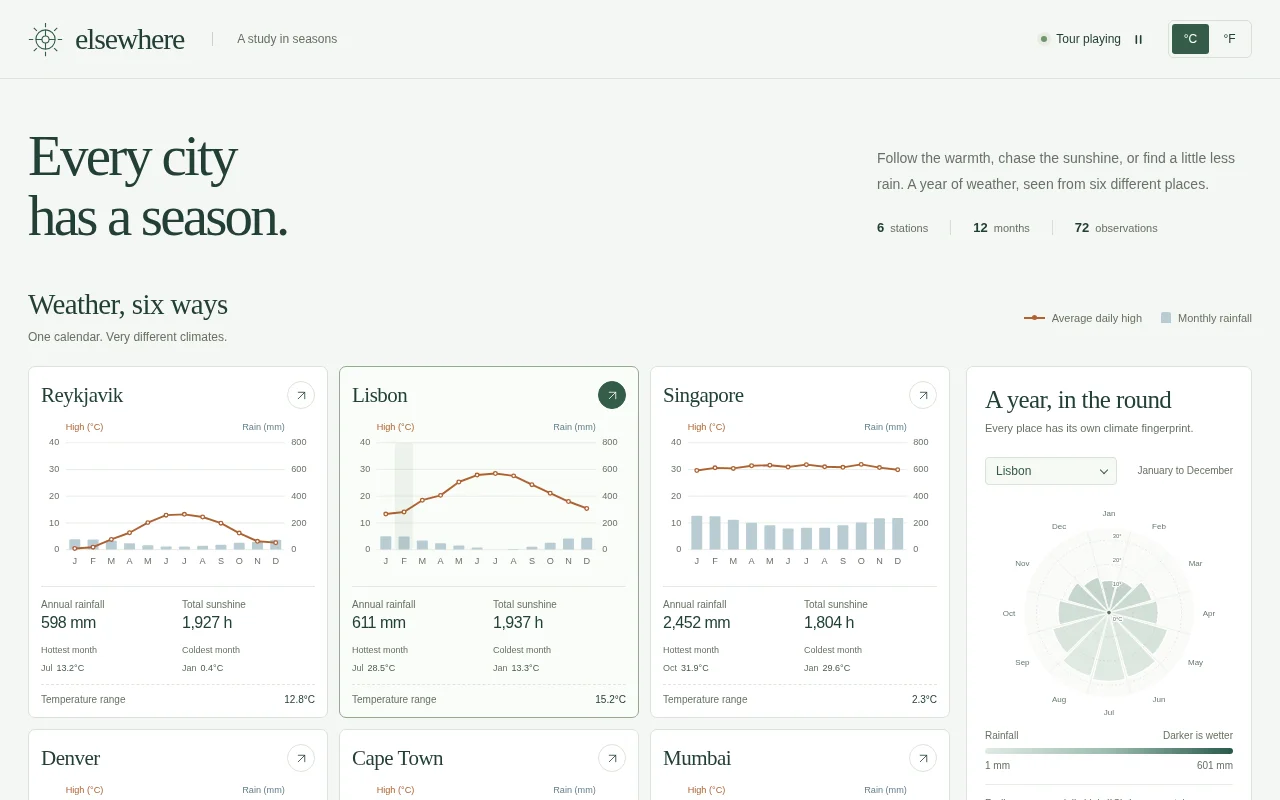
Open the live page in a new tab · Full result: prompt, transcript, cost and time
Football league season Test page · 2 finished of 2
The prompt (the same for every model)
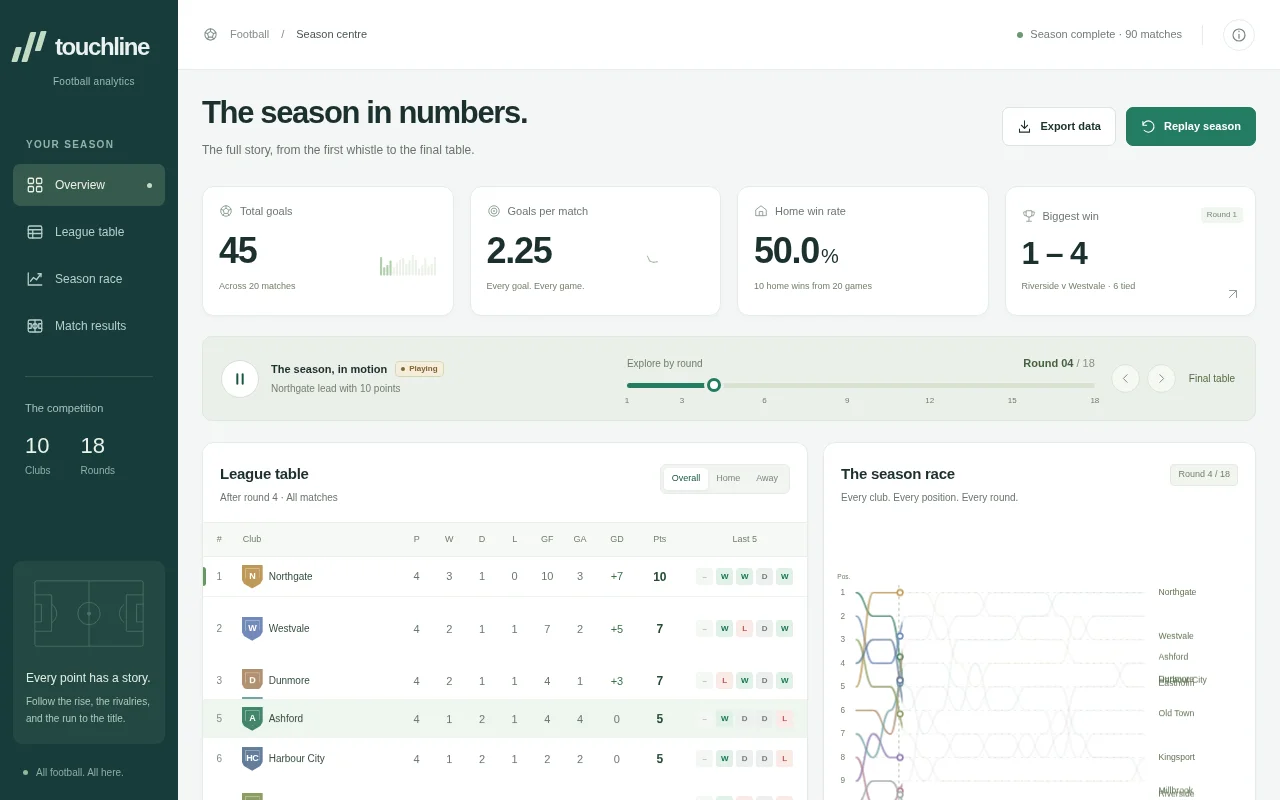
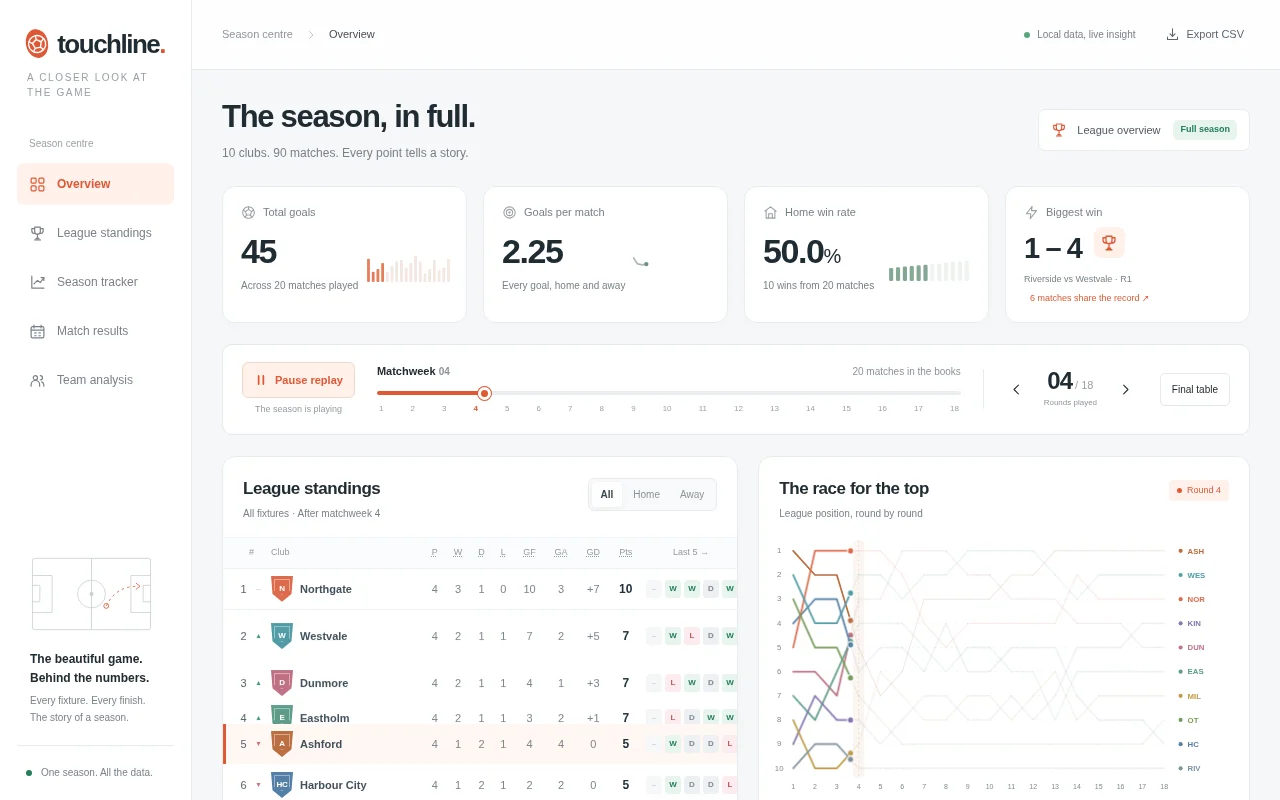
Build an interactive football league season dashboard from the exact dataset below (CSV: every match of a 10-team double round-robin season, 18 rounds, with home and away team and goals). Embed the data in the page verbatim and compute every number from it; do not invent or alter any value. Use 3 points for a win and 1 for a draw; rank by points, then goal difference, then goals scored, then team name. round,home,away,home_goals,away_goals 1,Harbour City,Dunmore,1,0 1,Northgate,Eastholm,1,0 1,Riverside,Westvale,1,4 1,Old Town,Millbrook,3,1 1,Kingsport,Ashford,1,4 2,Harbour City,Eastholm,1,1 2,Dunmore,Westvale,1,0 2,Northgate,Millbrook,3,0 2,Riverside,Ashford,0,0 2,Old Town,Kingsport,0,1 3,Harbour City,Westvale,0,0 3,Eastholm,Millbrook,1,0 3,Dunmore,Ashford,0,0 3,Northgate,Kingsport,2,2 3,Riverside,Old Town,2,2 4,Harbour City,Millbrook,0,1 4,Westvale,Ashford,3,0 4,Eastholm,Kingsport,1,0 4,Dunmore,Old Town,3,0 4,Northgate,Riverside,4,1 5,Harbour City,Ashford,1,0 5,Millbrook,Kingsport,2,0 5,Westvale,Old Town,1,0 5,Eastholm,Riverside,2,0 5,Dunmore,Northgate,1,0 6,Harbour City,Kingsport,1,1 6,Ashford,Old Town,4,0 6,Millbrook,Riverside,0,0 6,Westvale,Northgate,1,1 6,Eastholm,Dunmore,1,2 7,Harbour City,Old Town,1,1 7,Kingsport,Riverside,4,2 7,Ashford,Northgate,2,0 7,Millbrook,Dunmore,1,1 7,Westvale,Eastholm,1,1 8,Harbour City,Riverside,1,0 8,Old Town,Northgate,2,2 8,Kingsport,Dunmore,1,2 8,Ashford,Eastholm,3,0 8,Millbrook,Westvale,1,3 9,Harbour City,Northgate,1,3 9,Riverside,Dunmore,1,0 9,Old Town,Eastholm,0,2 9,Kingsport,Westvale,0,1 9,Ashford,Millbrook,1,1 10,Dunmore,Harbour City,3,1 10,Eastholm,Northgate,1,1 10,Westvale,Riverside,1,0 10,Millbrook,Old Town,1,1 10,Ashford,Kingsport,3,1 11,Eastholm,Harbour City,1,2 11,Westvale,Dunmore,2,2 11,Millbrook,Northgate,0,4 11,Ashford,Riverside,3,0 11,Kingsport,Old Town,3,1 12,Westvale,Harbour City,2,1 12,Millbrook,Eastholm,3,2 12,Ashford,Dunmore,4,0 12,Kingsport,Northgate,1,1 12,Old Town,Riverside,0,0 13,Millbrook,Harbour City,1,0 13,Ashford,Westvale,1,0 13,Kingsport,Eastholm,2,0 13,Old Town,Dunmore,0,1 13,Riverside,Northgate,0,1 14,Ashford,Harbour City,2,1 14,Kingsport,Millbrook,2,0 14,Old Town,Westvale,0,0 14,Riverside,Eastholm,0,2 14,Northgate,Dunmore,2,0 15,Kingsport,Harbour City,4,1 15,Old Town,Ashford,2,1 15,Riverside,Millbrook,0,1 15,Northgate,Westvale,1,3 15,Dunmore,Eastholm,0,2 16,Old Town,Harbour City,1,0 16,Riverside,Kingsport,2,4 16,Northgate,Ashford,0,1 16,Dunmore,Millbrook,0,0 16,Eastholm,Westvale,0,0 17,Riverside,Harbour City,1,0 17,Northgate,Old Town,2,0 17,Dunmore,Kingsport,0,3 17,Eastholm,Ashford,1,1 17,Westvale,Millbrook,2,0 18,Northgate,Harbour City,4,2 18,Dunmore,Riverside,0,3 18,Eastholm,Old Town,0,1 18,Westvale,Kingsport,3,1 18,Millbrook,Ashford,0,2 The dashboard needs: the final league table (played, won, drawn, lost, goals for, goals against, goal difference, points, and a form guide of the last five results as coloured chips); a position-by-round bump chart showing every team's league position after each round, with a team highlighted on hover or tap; a round slider that recomputes the table as it stood after any round; home versus away performance bars per team; a results matrix (home team rows by away team columns) with scores and win/draw/loss colouring; KPI cards for total goals, goals per match, home win percentage and the biggest win; a team detail panel with its points trajectory and results list; and filters for home-only or away-only tables. Make it look like a premium sports data site. So the page is alive without input, on load it animates the bump chart round by round with the table re-ordering live as the round slider advances from 1 to 18, then spotlights the champion, the biggest climber and the biggest win, and restarts, forever, until the user touches a control. Save it as index.html in the current directory: one self-contained file with inline CSS and JavaScript only, no libraries or frameworks, and no external requests of any kind (no CDNs, web fonts, images or audio files). It must work when opened directly from disk, fit any window from a 390 px wide phone to a desktop, and run without console errors. You may serve it locally and open it in headless chromium (/usr/bin/chromium, software WebGL, no GPU) to screenshot and inspect your own output, and iterate on your own before finishing. Close any browser you open as soon as you've taken your screenshot.
Marathon results Test page · 2 finished of 2
The prompt (the same for every model)
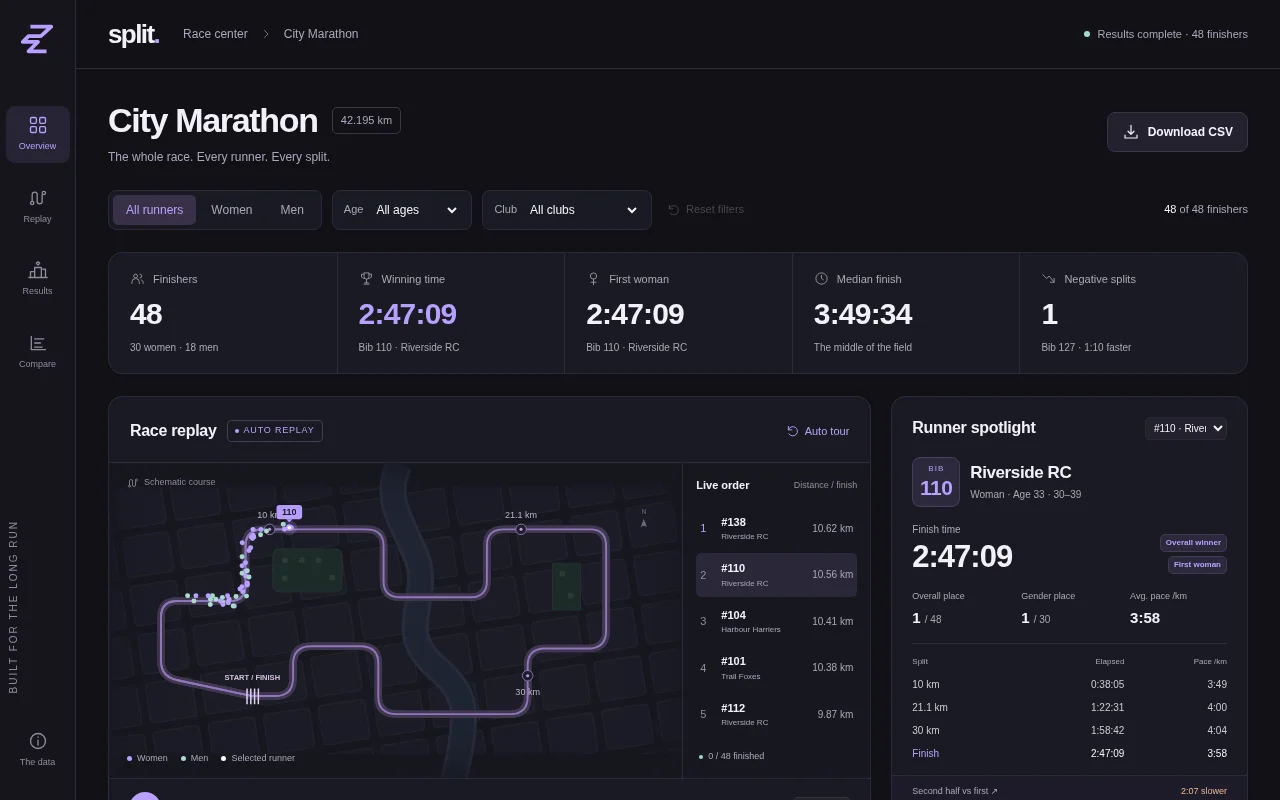
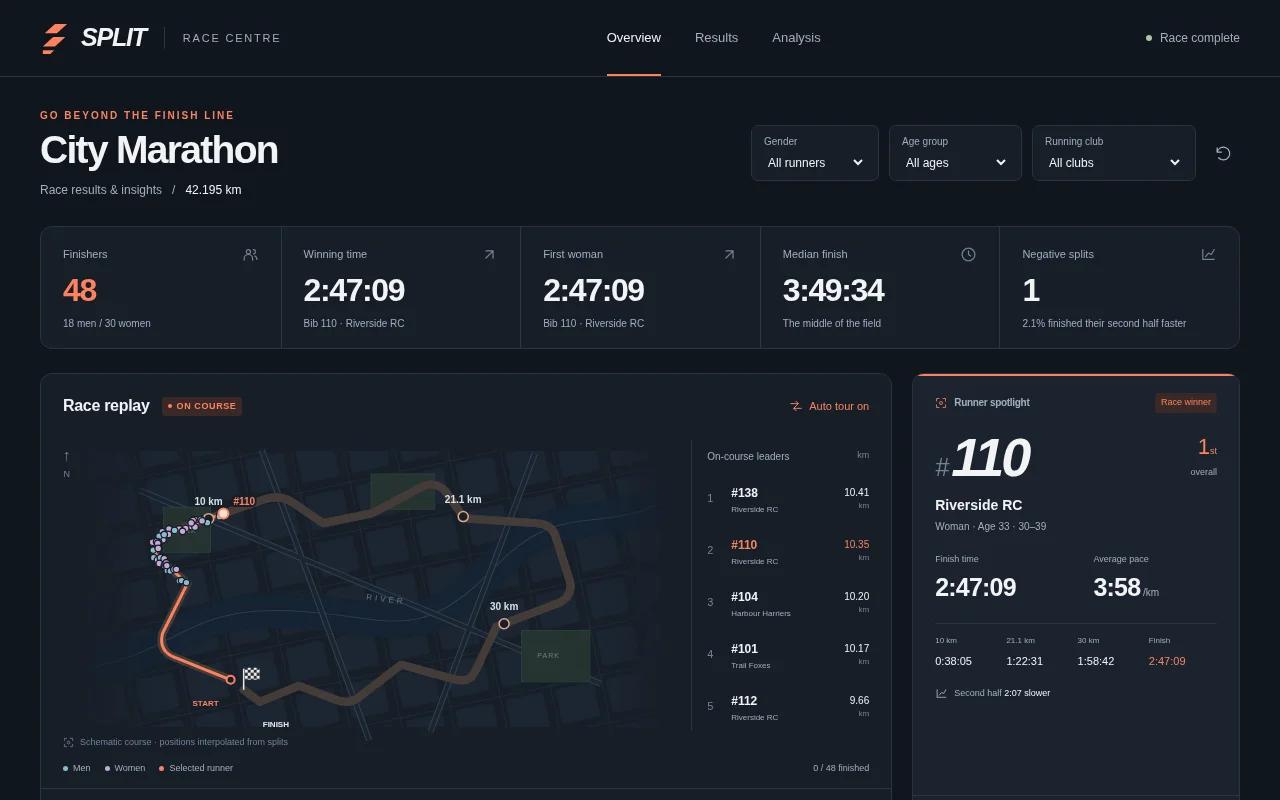
Build an interactive race results dashboard for a city marathon from the exact dataset below (CSV: one row per finisher with bib number, running club, gender, age, and cumulative split times at 10 km, 21.1 km, 30 km and the finish, as h:mm:ss). Embed the data in the page verbatim and compute every number from it; do not invent or alter any value. bib,club,gender,age,split_10k,split_21k,split_30k,finish 101,Trail Foxes,M,42,0:38:49,1:23:18,2:00:42,2:53:35 102,Hill Striders,M,31,0:56:17,2:00:23,2:54:35,4:08:29 103,Trail Foxes,F,32,0:53:48,1:57:22,2:48:26,3:59:47 104,Harbour Harriers,F,34,0:38:43,1:22:03,1:58:26,2:50:16 105,Unattached,M,63,0:49:28,1:47:17,2:35:54,3:41:18 106,Harbour Harriers,F,47,0:43:01,1:33:33,2:15:02,3:10:08 107,Riverside RC,F,46,0:57:12,2:01:54,2:56:06,4:11:08 108,Hill Striders,F,65,0:58:44,2:04:07,2:59:04,4:14:16 109,Trail Foxes,M,23,0:47:00,1:41:05,2:27:59,3:33:42 110,Riverside RC,F,33,0:38:05,1:22:31,1:58:42,2:47:09 111,Hill Striders,F,24,0:49:32,1:46:25,2:33:20,3:36:35 112,Riverside RC,M,31,0:40:53,1:25:55,2:04:02,2:56:05 113,Hill Striders,F,23,0:59:57,2:07:30,3:05:48,4:24:21 114,Hill Striders,F,56,0:43:40,1:31:52,2:12:51,3:08:42 115,Night Owls,F,27,1:04:18,2:16:58,3:17:51,4:43:11 116,Trail Foxes,F,32,0:52:37,1:53:05,2:43:31,3:50:54 117,Riverside RC,F,61,0:58:21,2:06:34,3:03:57,4:21:53 118,Night Owls,M,56,1:09:04,2:29:52,3:35:02,5:03:19 119,Trail Foxes,F,41,0:51:51,1:50:44,2:39:58,3:48:28 120,Trail Foxes,M,46,0:50:39,1:47:19,2:33:58,3:37:12 121,Unattached,F,23,0:43:04,1:31:38,2:12:22,3:09:08 122,Night Owls,M,23,1:02:58,2:15:44,3:15:51,4:35:10 123,Harbour Harriers,M,20,1:00:07,2:08:57,3:05:52,4:23:52 124,Hill Striders,M,43,1:01:59,2:11:47,3:11:33,4:34:11 125,Riverside RC,F,22,0:50:26,1:48:00,2:33:34,3:36:33 126,Trail Foxes,F,39,0:58:33,2:04:49,3:00:44,4:19:12 127,Trail Foxes,M,46,0:54:21,1:56:35,2:45:20,3:52:00 128,Night Owls,F,64,0:45:32,1:37:06,2:21:19,3:22:05 129,Night Owls,M,65,1:11:26,2:30:42,3:41:16,5:16:12 130,Night Owls,M,52,0:49:55,1:45:53,2:31:22,3:31:47 131,Night Owls,M,60,1:03:35,2:15:31,3:13:10,4:33:22 132,Harbour Harriers,F,55,0:48:01,1:42:09,2:27:37,3:29:17 133,Riverside RC,M,43,1:00:00,2:10:39,3:06:46,4:24:18 134,Harbour Harriers,M,65,1:03:38,2:17:14,3:18:32,4:39:33 135,Trail Foxes,M,19,0:41:42,1:29:20,2:09:13,3:04:28 136,Unattached,F,47,1:08:22,2:25:56,3:30:25,4:56:39 137,Hill Striders,F,27,0:48:32,1:43:43,2:29:29,3:34:35 138,Riverside RC,F,35,0:37:55,1:20:58,1:58:03,2:49:59 139,Hill Striders,F,24,1:00:43,2:10:31,3:11:15,4:35:15 140,Harbour Harriers,F,67,0:52:15,1:52:16,2:45:10,3:58:17 141,Riverside RC,F,40,0:43:29,1:32:31,2:14:14,3:11:05 142,Unattached,M,31,0:57:26,2:02:30,2:58:16,4:18:08 143,Unattached,F,30,0:53:17,1:51:21,2:41:12,3:50:40 144,Hill Striders,F,28,0:44:48,1:37:12,2:20:19,3:19:02 145,Trail Foxes,F,34,0:42:36,1:31:24,2:10:59,3:03:51 146,Harbour Harriers,F,56,0:41:36,1:28:29,2:09:20,3:08:14 147,Unattached,F,57,0:52:02,1:49:55,2:40:54,3:53:11 148,Night Owls,F,56,0:45:58,1:36:48,2:18:55,3:15:52 The dashboard needs: a sortable, searchable results table with overall place, gender place, age group (under 30, 30-39, 40-49, 50-59, 60 and over), finish time and average pace per km; KPI cards for finishers, winning time, first woman, median finish time and the number of negative splits (second half faster than the first); a finish-time histogram with five-minute bins; a pace chart showing every runner's pace per segment as faint lines with the selected runner highlighted; a 'race replay' visual where every runner is a dot moving along a stylised course in proportion to their splits, with a time scrubber and leaderboard; club and age-group comparison bars; filters by gender, age group and club that update everything; and hover or tap details for any runner. Make it feel like a premium sports-broadcast graphic. So the page is alive without input, on load it plays the race replay from the gun to the last finisher on a loop with the leaderboard updating, then highlights the winner, the first woman and the runner with the strongest negative split in turn, forever, until the user touches a control. Save it as index.html in the current directory: one self-contained file with inline CSS and JavaScript only, no libraries or frameworks, and no external requests of any kind (no CDNs, web fonts, images or audio files). It must work when opened directly from disk, fit any window from a 390 px wide phone to a desktop, and run without console errors. You may serve it locally and open it in headless chromium (/usr/bin/chromium, software WebGL, no GPU) to screenshot and inspect your own output, and iterate on your own before finishing. Close any browser you open as soon as you've taken your screenshot.