Claude Opus 5.5 in Claude Code 2.1.280
skills off
Zoom, inline player and more ways to view
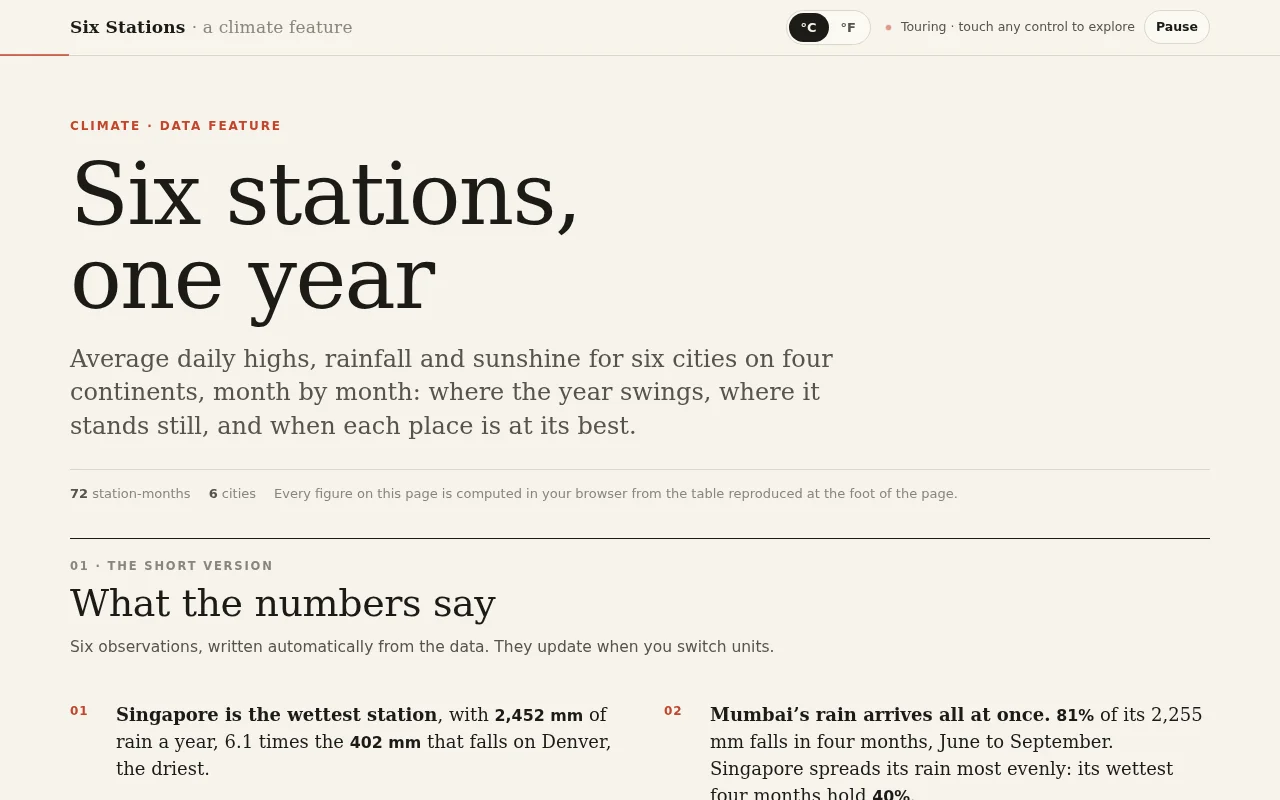
The model's own page, run in a sandboxed frame only when you ask (a page that needs its own origin opens in a new tab on a separate demo site). Phones get a full-screen player capped at 1.5x pixel density (2x on larger screens) so it stays smooth; the original page runs uncapped. Tap inside for sound.
Wall time 20m 14sCost $2.99 estimated
Review
No verdict yet.
The full review
OK. Finished on its own after 20.2 min.
Scores
AI judge
Not scored
No rubric for this prompt
Visitor votes and reviewer grades are not available yet.
- AI judge
- AI judge: the test runner (model claude-opus-5-5), scoring by visual review of the 1600 px render against the pre-registered rubric. No AI-judge score exists for this result: there is no rubric for this prompt, so no score is shown and none is made up.
- Visitors
- Public voting with a blind reveal is coming: you score the output first, then see the other scores.
- Reviewer
- The reviewer's own grade appears here once it is added.
Scores compare results for the same prompt only. AI-judge boards rank runs within one prompt, equal totals sharing a rank; scores from different prompts are never averaged.
Downloads
Files actually published for this run. Original output, site-made previews and post-run conversions are labelled separately.
The exact prompt
as run, 3,863 characters. Every result for this prompt
Build an interactive climate dashboard comparing six weather stations from the exact dataset below (CSV: one row per city and month with the average daily high temperature in Celsius, total rainfall in millimetres and sunshine hours). Embed the data in the page verbatim and compute every number from it; do not invent or alter any value.

city,month,avg_high_c,rain_mm,sun_hours
Reykjavik,Jan,0.4,77,54
Reykjavik,Feb,0.9,76,81
Reykjavik,Mar,3.8,67,116
Reykjavik,Apr,6.3,48,147
Reykjavik,May,10.1,32,221
Reykjavik,Jun,12.9,24,247
Reykjavik,Jul,13.2,24,274
Reykjavik,Aug,12.2,29,233
Reykjavik,Sep,9.9,37,214
Reykjavik,Oct,6.2,51,160
Reykjavik,Nov,3.1,59,103
Reykjavik,Dec,2.6,74,77
Lisbon,Jan,13.3,100,52
Lisbon,Feb,14.1,99,77
Lisbon,Mar,18.5,69,113
Lisbon,Apr,20.3,47,168
Lisbon,May,25.3,31,222
Lisbon,Jun,27.9,15,245
Lisbon,Jul,28.5,1,259
Lisbon,Aug,27.6,5,259
Lisbon,Sep,24.3,21,212
Lisbon,Oct,21.1,51,146
Lisbon,Nov,18.0,83,100
Lisbon,Dec,15.4,89,84
Singapore,Jan,29.6,254,152
Singapore,Feb,30.6,249,136
Singapore,Mar,30.4,223,151
Singapore,Apr,31.4,201,174
Singapore,May,31.6,183,132
Singapore,Jun,30.9,158,155
Singapore,Jul,31.8,164,167
Singapore,Aug,31.0,163,160
Singapore,Sep,30.8,182,130
Singapore,Oct,31.9,203,172
Singapore,Nov,30.7,235,129
Singapore,Dec,29.9,237,146
Denver,Jan,5.9,47,63
Denver,Feb,7.5,42,76
Denver,Mar,11.6,41,101
Denver,Apr,18.0,40,160
Denver,May,24.9,27,219
Denver,Jun,30.0,23,251
Denver,Jul,30.7,22,253
Denver,Aug,29.4,25,241
Denver,Sep,24.9,38,201
Denver,Oct,17.6,29,153
Denver,Nov,12.2,33,106
Denver,Dec,7.4,35,64
Cape Town,Jan,27.6,9,269
Cape Town,Feb,25.9,16,279
Cape Town,Mar,24.9,30,236
Cape Town,Apr,23.3,60,192
Cape Town,May,21.0,68,142
Cape Town,Jun,18.1,87,111
Cape Town,Jul,17.8,94,111
Cape Town,Aug,18.8,79,131
Cape Town,Sep,20.3,69,163
Cape Town,Oct,22.7,46,187
Cape Town,Nov,24.4,35,227
Cape Town,Dec,25.9,16,280
Mumbai,Jan,30.2,7,62
Mumbai,Feb,30.0,6,68
Mumbai,Mar,29.9,11,121
Mumbai,Apr,32.1,79,166
Mumbai,May,33.0,247,205
Mumbai,Jun,33.0,481,245
Mumbai,Jul,33.2,601,273
Mumbai,Aug,32.3,494,241
Mumbai,Sep,32.5,252,225
Mumbai,Oct,31.5,67,166
Mumbai,Nov,29.8,3,115
Mumbai,Dec,30.1,7,81

The dashboard needs: small-multiple climate charts, one per city, each with monthly temperature as a line over rainfall as bars and the two axes clearly labelled; a radial (polar) chart of the selected city's year with temperature as radius and rainfall as colour; a heatmap of temperature by city and month; KPI cards per city for annual rainfall, hottest and coldest month, temperature range and total sunshine; a 'best month to visit' calculator with sliders for preferred temperature range, maximum rain and minimum sunshine that scores every city-month and lists the top five; a Celsius and Fahrenheit toggle; hover or tap tooltips with exact values; and a short auto-written comparison panel computed from the data. Make it beautiful, editorial and calm, like a data feature in a great magazine. So the page is alive without input, on load the charts draw in and a tour cycles forever: it rotates the radial chart through each city, sweeps a highlight across the heatmap month by month, adjusts the visit calculator sliders to show the ranking change, and toggles units once per loop, until the user touches a control.

Save it as index.html in the current directory: one self-contained file with inline CSS and JavaScript only, no libraries or frameworks, and no external requests of any kind (no CDNs, web fonts, images or audio files). It must work when opened directly from disk, fit any window from a 390 px wide phone to a desktop, and run without console errors. You may serve it locally and open it in headless chromium (/usr/bin/chromium, software WebGL, no GPU) to screenshot and inspect your own output, and iterate on your own before finishing. Close any browser you open as soon as you've taken your screenshot.
How it was made
Versions saved during the run
6 intermediate outputs, in the order the model wrote them.


No transcript was delivered with this result.
Cost breakdown
Headline cost $2.99, estimated from the token counts at list price.
| Tokens by type | Tokens | $ per 1M | Cost |
|---|---|---|---|
| Input (uncached) | 56 | $4.00 | $0.0002 |
| Cache write | 136,996 | $5.00 | $0.6850 |
| Cache read | 3,131,054 | $0.20 | $0.6262 |
| Output | 83,754 | $20.00 | $1.6751 |
| of which reasoning | 41,088 | billed as output |
- Total computed from tokens
- $2.9865
- Total reported by the harness
- none
Computed from harness-reported token counts x list prices.
Prices: Project price table (vendor list prices), 2026-09-22.
Run notes
- frozen prompt (written): written 2026-10-05 for the MR category expansion (owner request: 500 finished runs in every category); category data_dashboards; zero results
- plain wave-1-equivalent cc_config copy (settings.json + .claude.json; no ECC files)
- Mode: interactive TUI in tmux (160x48), inside bubblewrap sandbox
- Context setting: 1M ([1m] model name)
- Isolation audit: none
- Renderer: SVG drawn by plain JavaScript (document.createElementNS at index.html line 551) in one self-contained HTML file; no libraries, no CDN, no external assets, no canvas. No WebGPU or WebGL needed.
- Card video: the run's own 8 s session capture (video.mp4, H.264 yuv420p, 1280x720). Poster: the run's own render.png.