World weather stations
Build an interactive climate dashboard comparing six weather stations from the exact dataset below (CSV: one row per city and month with the average daily hi…
More
1 test · 3 finished runs (3 agent, 0 raw one-shot) · 3 live demos
The prompt
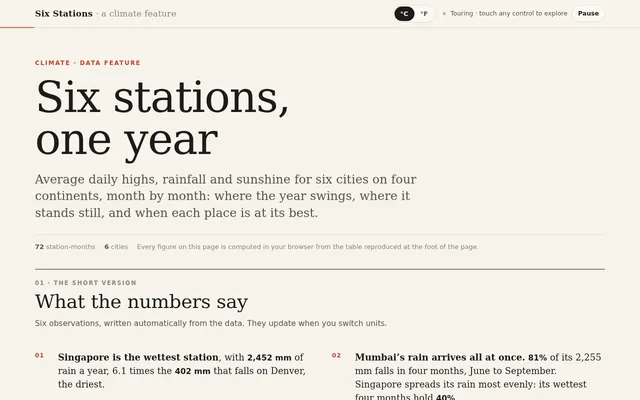
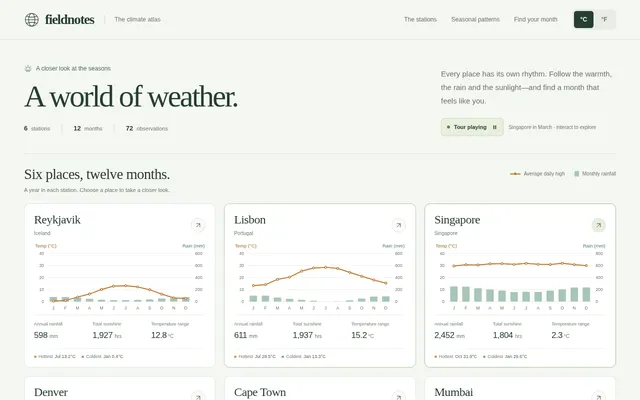
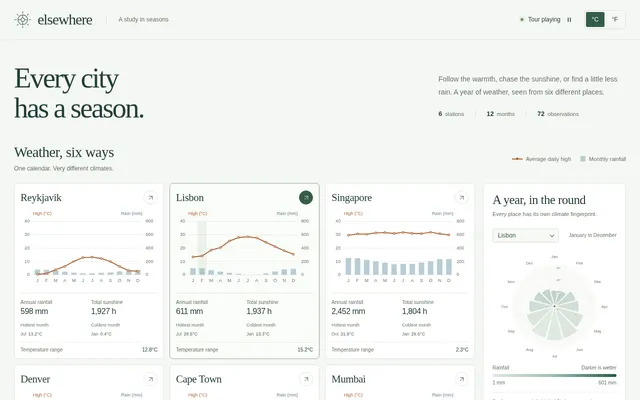
Build an interactive climate dashboard comparing six weather stations from the exact dataset below (CSV: one row per city and month with the average daily high temperature in Celsius, total rainfall in millimetres and sunshine hours). Embed the data in the page verbatim and compute every number from it; do not invent or alter any value. city,month,avg_high_c,rain_mm,sun_hours Reykjavik,Jan,0.4,77,54 Reykjavik,Feb,0.9,76,81 Reykjavik,Mar,3.8,67,116 Reykjavik,Apr,6.3,48,147 Reykjavik,May,10.1,32,221 Reykjavik,Jun,12.9,24,247 Reykjavik,Jul,13.2,24,274 Reykjavik,Aug,12.2,29,233 Reykjavik,Sep,9.9,37,214 Reykjavik,Oct,6.2,51,160 Reykjavik,Nov,3.1,59,103 Reykjavik,Dec,2.6,74,77 Lisbon,Jan,13.3,100,52 Lisbon,Feb,14.1,99,77 Lisbon,Mar,18.5,69,113 Lisbon,Apr,20.3,47,168 Lisbon,May,25.3,31,222 Lisbon,Jun,27.9,15,245 Lisbon,Jul,28.5,1,259 Lisbon,Aug,27.6,5,259 Lisbon,Sep,24.3,21,212 Lisbon,Oct,21.1,51,146 Lisbon,Nov,18.0,83,100 Lisbon,Dec,15.4,89,84 Singapore,Jan,29.6,254,152 Singapore,Feb,30.6,249,136 Singapore,Mar,30.4,223,151 Singapore,Apr,31.4,201,174 Singapore,May,31.6,183,132 Singapore,Jun,30.9,158,155 Singapore,Jul,31.8,164,167 Singapore,Aug,31.0,163,160 Singapore,Sep,30.8,182,130 Singapore,Oct,31.9,203,172 Singapore,Nov,30.7,235,129 Singapore,Dec,29.9,237,146 Denver,Jan,5.9,47,63 Denver,Feb,7.5,42,76 Denver,Mar,11.6,41,101 Denver,Apr,18.0,40,160 Denver,May,24.9,27,219 Denver,Jun,30.0,23,251 Denver,Jul,30.7,22,253 Denver,Aug,29.4,25,241 Denver,Sep,24.9,38,201 Denver,Oct,17.6,29,153 Denver,Nov,12.2,33,106 Denver,Dec,7.4,35,64 Cape Town,Jan,27.6,9,269 Cape Town,Feb,25.9,16,279 Cape Town,Mar,24.9,30,236 Cape Town,Apr,23.3,60,192 Cape Town,May,21.0,68,142 Cape Town,Jun,18.1,87,111 Cape Town,Jul,17.8,94,111 Cape Town,Aug,18.8,79,131 Cape Town,Sep,20.3,69,163 Cape Town,Oct,22.7,46,187 Cape Town,Nov,24.4,35,227 Cape Town,Dec,25.9,16,280 Mumbai,Jan,30.2,7,62 Mumbai,Feb,30.0,6,68 Mumbai,Mar,29.9,11,121 Mumbai,Apr,32.1,79,166 Mumbai,May,33.0,247,205 Mumbai,Jun,33.0,481,245 Mumbai,Jul,33.2,601,273 Mumbai,Aug,32.3,494,241 Mumbai,Sep,32.5,252,225 Mumbai,Oct,31.5,67,166 Mumbai,Nov,29.8,3,115 Mumbai,Dec,30.1,7,81 The dashboard needs: small-multiple climate charts, one per city, each with monthly temperature as a line over rainfall as bars and the two axes clearly labelled; a radial (polar) chart of the selected city's year with temperature as radius and rainfall as colour; a heatmap of temperature by city and month; KPI cards per city for annual rainfall, hottest and coldest month, temperature range and total sunshine; a 'best month to visit' calculator with sliders for preferred temperature range, maximum rain and minimum sunshine that scores every city-month and lists the top five; a Celsius and Fahrenheit toggle; hover or tap tooltips with exact values; and a short auto-written comparison panel computed from the data. Make it beautiful, editorial and calm, like a data feature in a great magazine. So the page is alive without input, on load the charts draw in and a tour cycles forever: it rotates the radial chart through each city, sweeps a highlight across the heatmap month by month, adjusts the visit calculator sliders to show the ranking change, and toggles units once per loop, until the user touches a control. Save it as index.html in the current directory: one self-contained file with inline CSS and JavaScript only, no libraries or frameworks, and no external requests of any kind (no CDNs, web fonts, images or audio files). It must work when opened directly from disk, fit any window from a 390 px wide phone to a desktop, and run without console errors. You may serve it locally and open it in headless chromium (/usr/bin/chromium, software WebGL, no GPU) to screenshot and inspect your own output, and iterate on your own before finishing. Close any browser you open as soon as you've taken your screenshot.
Same prompt, all models: step through 3 runsIn the gallery: one player, arrow keys or swipe.