Coffee chain sales
Build an interactive sales dashboard for a small coffee chain from the exact dataset below (CSV, 48 rows: 4 stores x 12 months of 2025).
More
1 test · 5 finished runs (5 agent, 0 raw one-shot) · 5 live demos
The prompt
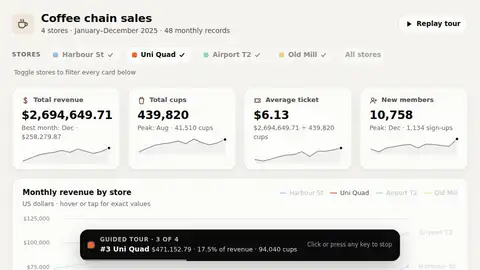
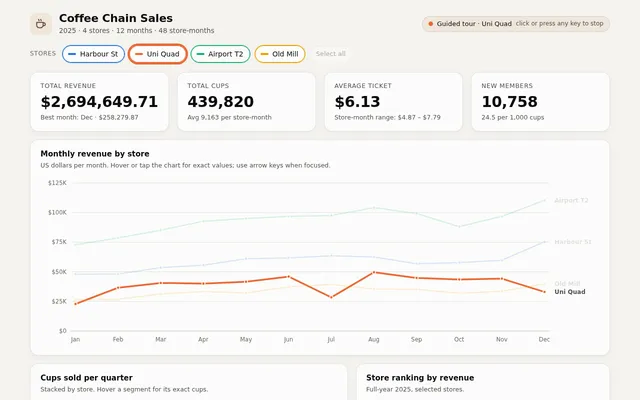
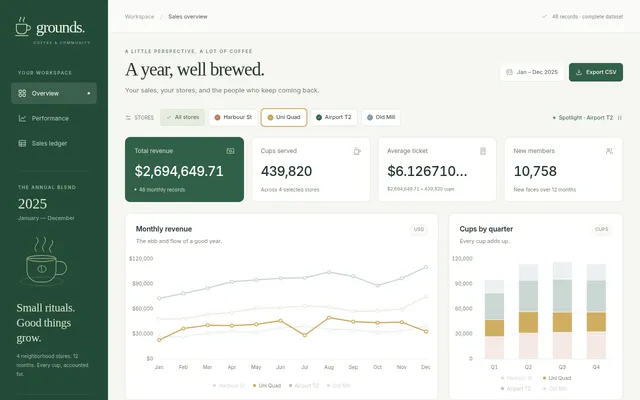
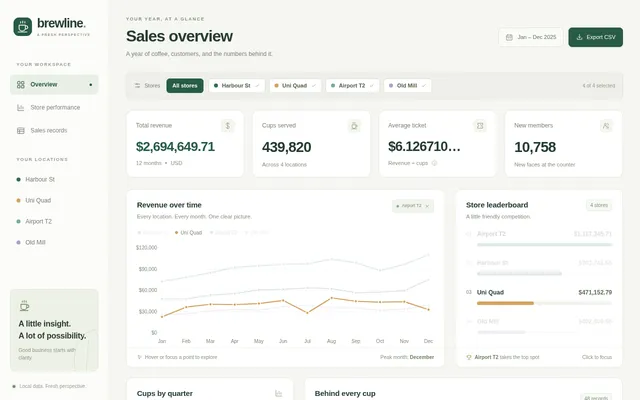
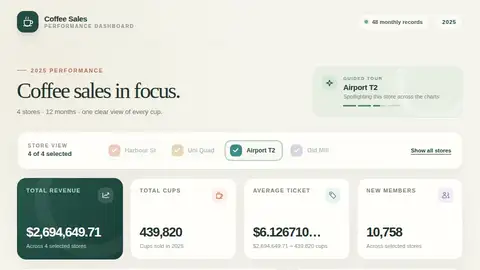
Build an interactive sales dashboard for a small coffee chain from the exact dataset below (CSV, 48 rows: 4 stores x 12 months of 2025). Embed the data in the page verbatim and compute every number from it; do not invent, round away or alter any value. month,store,cups,revenue_usd,new_members 2025-01,Harbour St,8620,48001.40,219 2025-01,Uni Quad,4670,22784.08,136 2025-01,Airport T2,9980,72817.87,285 2025-01,Old Mill,5140,26339.15,156 2025-02,Harbour St,8660,48132.70,179 2025-02,Uni Quad,7510,36583.14,176 2025-02,Airport T2,10710,78626.32,196 2025-02,Old Mill,5120,26783.20,145 2025-03,Harbour St,9600,53507.52,224 2025-03,Uni Quad,8140,40574.60,197 2025-03,Airport T2,11420,85142.33,222 2025-03,Old Mill,5980,31337.13,191 2025-04,Harbour St,9950,55661.36,280 2025-04,Uni Quad,8080,40043.67,147 2025-04,Airport T2,12350,92727.38,298 2025-04,Old Mill,6240,33325.28,151 2025-05,Harbour St,10520,61004.42,275 2025-05,Uni Quad,8460,41597.39,177 2025-05,Airport T2,12500,94954.01,301 2025-05,Old Mill,6130,32148.65,176 2025-06,Harbour St,10620,61721.59,313 2025-06,Uni Quad,9200,45959.02,213 2025-06,Airport T2,12750,96839.34,255 2025-06,Old Mill,6940,37380.48,168 2025-07,Harbour St,10960,63515.58,232 2025-07,Uni Quad,5610,28440.56,130 2025-07,Airport T2,13010,97534.46,267 2025-07,Old Mill,7310,39219.21,204 2025-08,Harbour St,11000,62556.63,252 2025-08,Uni Quad,9900,49592.99,265 2025-08,Airport T2,13860,104199.02,279 2025-08,Old Mill,6750,35505.26,164 2025-09,Harbour St,9960,56831.50,271 2025-09,Uni Quad,8750,44825.12,174 2025-09,Airport T2,12770,99211.32,301 2025-09,Old Mill,6520,35173.20,204 2025-10,Harbour St,9800,57724.32,231 2025-10,Uni Quad,8510,43550.50,222 2025-10,Airport T2,11410,88144.32,282 2025-10,Old Mill,5920,31946.68,180 2025-11,Harbour St,10260,59774.09,229 2025-11,Uni Quad,8660,44209.58,203 2025-11,Airport T2,12430,96807.87,266 2025-11,Old Mill,6160,33615.60,188 2025-12,Harbour St,12660,75310.44,360 2025-12,Uni Quad,6550,32992.14,188 2025-12,Airport T2,14490,110341.47,368 2025-12,Old Mill,7280,39635.82,218 The dashboard needs: KPI cards for total revenue, total cups, average ticket (revenue / cups) and total new members; a monthly revenue line chart with one line per store; a stacked bar chart of cups per quarter split by store; a ranking of stores by revenue; and a table of the raw rows that can be sorted by clicking any column header. Store filter toggles must update every KPI, chart and the table together. Hovering any chart point or bar shows a tooltip with its exact values. Format money as US dollars with thousands separators. Draw the charts yourself with SVG or Canvas. So the page is alive without input, it plays a short guided tour on load: it highlights each store in turn for about 2 seconds (dimming the others in every chart), then returns to all stores; any click or key press stops the tour. Make it look like a polished product, readable on desktop and phone. Save it as index.html in the current directory: one self-contained file with inline CSS and JavaScript only, no libraries or frameworks, and no external requests of any kind (no CDNs, web fonts, images or audio files). It must work when opened directly from disk, fit any window from a 390 px wide phone to a desktop, and run without console errors. You may serve it locally and open it in headless chromium (/usr/bin/chromium, software WebGL, no GPU) to screenshot and inspect your own output, and iterate on your own before finishing. Close any browser you open as soon as you've taken your screenshot.
Same prompt, all models: step through 5 runsIn the gallery: one player, arrow keys or swipe.