Power grid day
Build an interactive electricity grid dashboard for one day on a regional power grid from the exact dataset below (CSV: hourly average generation by source i…
More
1 test · 3 finished runs (3 agent, 0 raw one-shot) · 3 live demos
The prompt
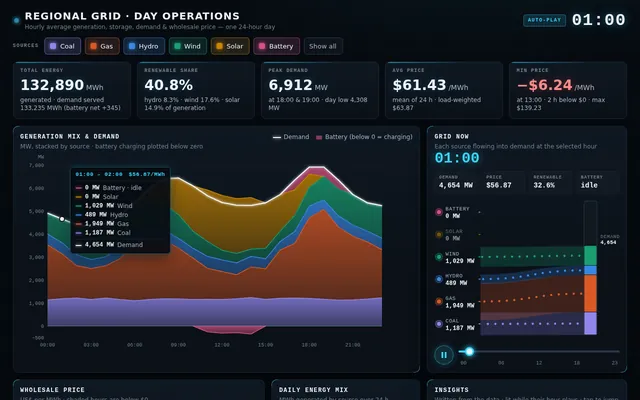
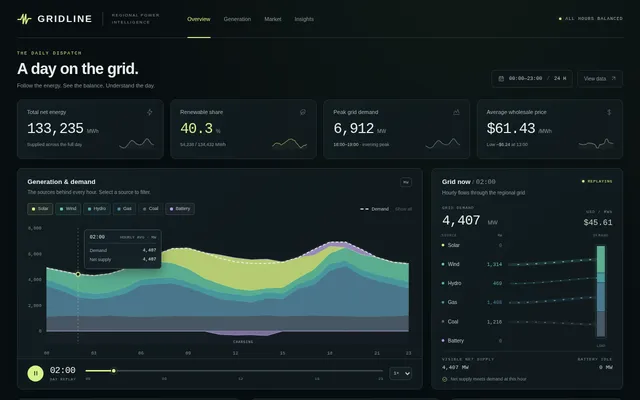
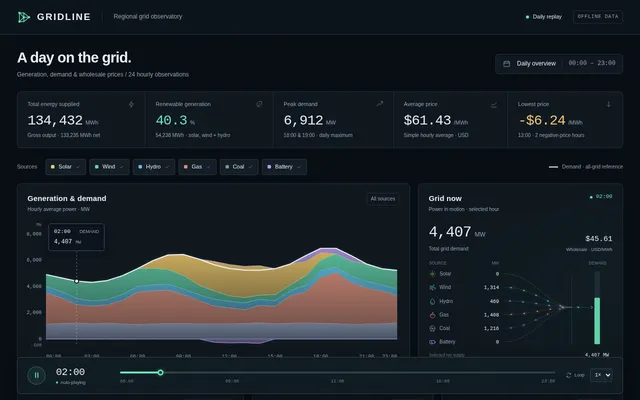
Build an interactive electricity grid dashboard for one day on a regional power grid from the exact dataset below (CSV: hourly average generation by source in megawatts, battery output where negative values mean the batteries are charging, total demand, and the wholesale price in US dollars per megawatt-hour). Embed the data in the page verbatim and compute every number from it; do not invent or alter any value. hour,solar_mw,wind_mw,hydro_mw,gas_mw,coal_mw,battery_mw,demand_mw,price_usd_mwh 00:00,0,908,477,2389,1134,0,4908,66.39 01:00,0,1029,489,1949,1187,0,4654,56.87 02:00,0,1314,469,1408,1216,0,4407,45.61 03:00,0,1416,389,1348,1155,0,4308,48.33 04:00,0,1444,389,1400,1217,0,4450,50.12 05:00,0,1420,472,1781,1150,0,4823,53.61 06:00,0,1364,425,2478,1100,0,5367,70.84 07:00,574,1275,457,2517,1149,0,5972,72.42 08:00,1115,1114,449,2543,1186,0,6407,69.67 09:00,1591,1034,421,2210,1181,0,6437,65.77 10:00,1975,737,428,1798,1154,0,6092,57.38 11:00,2244,644,520,1345,1161,-256,5658,43.57 12:00,2383,422,503,1220,1150,-309,5369,-5.25 13:00,2383,407,517,1047,1182,-287,5249,-6.24 14:00,2244,313,465,1324,1239,-345,5240,48.61 15:00,1975,459,430,1334,1158,0,5356,44.95 16:00,1591,448,380,2092,1205,0,5716,60.08 17:00,1115,697,510,2375,1220,431,6348,65.74 18:00,574,809,515,3503,1199,312,6912,133.18 19:00,0,1027,408,3908,1164,405,6912,139.23 20:00,0,1161,491,3178,1124,394,6348,82.08 21:00,0,1326,487,2768,1135,0,5716,74.8 22:00,0,1226,477,2481,1171,0,5355,71.86 23:00,0,1411,501,2088,1231,0,5231,64.7 The dashboard needs: a stacked area chart of the generation mix over the 24 hours with demand drawn as a line on top and battery charging shown below the zero axis; KPI cards for total energy in MWh, renewable share of generation, peak demand and its hour, and the daily average and minimum price; a price line chart with negative-price hours shaded and labelled; a donut of the daily energy mix by source; a live 'grid now' panel driven by an hour scrubber that shows each source as an animated flow into the demand bar; source toggles that update every chart; hover or tap tooltips with exact values; and a short auto-written insights panel computed from the data (for example when solar exceeded half of demand, when batteries charged and discharged). Style it like a control-room display: dark, precise, glowing. So the page is alive without input, on load the charts draw in and the hour scrubber plays through the day on a loop with the flow panel animating, tooltips following the playhead and the insights highlighting as their hours pass, forever, until the user touches a control. Save it as index.html in the current directory: one self-contained file with inline CSS and JavaScript only, no libraries or frameworks, and no external requests of any kind (no CDNs, web fonts, images or audio files). It must work when opened directly from disk, fit any window from a 390 px wide phone to a desktop, and run without console errors. You may serve it locally and open it in headless chromium (/usr/bin/chromium, software WebGL, no GPU) to screenshot and inspect your own output, and iterate on your own before finishing. Close any browser you open as soon as you've taken your screenshot.
Same prompt, all models: step through 3 runsIn the gallery: one player, arrow keys or swipe.