Kimi K3 in a raw API call
raw API baseline
Zoom, inline player and more ways to view
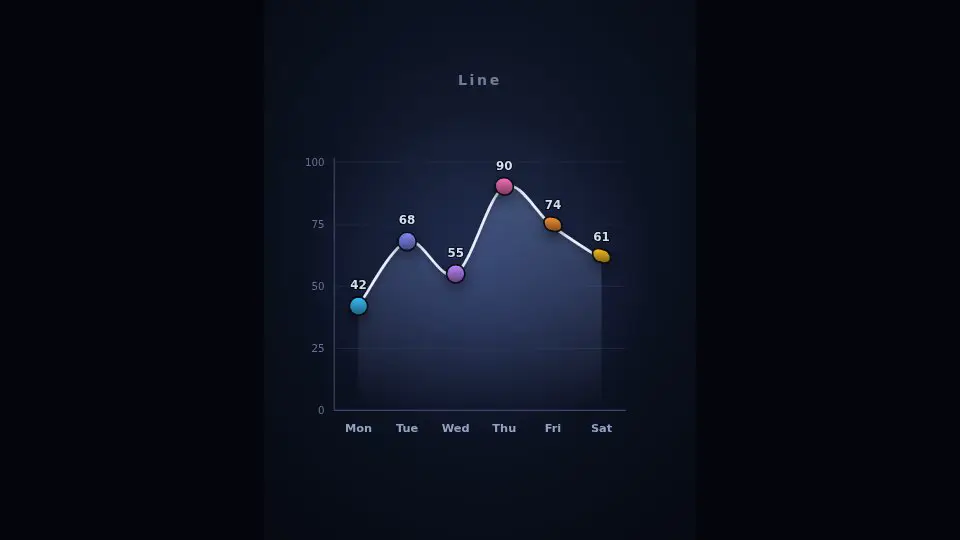
The model's own page, run in a sandboxed frame only when you ask (a page that needs its own origin opens in a new tab on a separate demo site). Phones get a full-screen player capped at 1.5x pixel density (2x on larger screens) so it stays smooth; the original page runs uncapped. Tap inside for sound.
Recorded from the live demo. Preview video recorded by this site from the live demo. The moving picture above is that preview; the button runs the real page.
Wall time 19m 53sCost not recorded: the run's token counts were never reported, so there is no estimate
Review
No verdict yet.
The full review
OK. finish=stop
Scores
AI judge
Not scored
No rubric for this prompt
Visitor votes and reviewer grades are not available yet.
- AI judge
- AI judge: the test runner (model claude-opus-5-5), scoring by visual review of the 1600 px render against the pre-registered rubric. No AI-judge score exists for this result: there is no rubric for this prompt, so no score is shown and none is made up.
- Visitors
- Public voting with a blind reveal is coming: you score the output first, then see the other scores.
- Reviewer
- The reviewer's own grade appears here once it is added.
Scores compare results for the same prompt only. AI-judge boards rank runs within one prompt, equal totals sharing a rank; scores from different prompts are never averaged.
Downloads
Files actually published for this run. Original output, site-made previews and post-run conversions are labelled separately.
The exact prompt
raw API call, 1,696 characters. Every result for this prompt
Create a single self-contained HTML file (inline CSS and JavaScript only; SVG for all graphics; no canvas, no external libraries, fonts or network requests) that plays a polished motion graphic, like a studio-made data animation.

The motion: one dataset of 6 values (Mon-Sat: 42, 68, 55, 90, 74, 61) morphs through three chart states in a continuous loop:
1. Bar chart: 6 bars grow up from the baseline, with axis, gridlines and value labels.
2. The bars smoothly morph into a line chart: each bar collapses into a point at its top, the points connect with a line that draws itself, and an area fill fades in beneath it.
3. The line chart morphs into a donut chart: the 6 values become 6 coloured arcs that sweep around a ring, with the total counting up in the centre.
4. The donut morphs back into the bar chart and the loop repeats.
Each state holds for about 2 seconds and each transition takes about 1.5 seconds, so one loop is about 14 seconds. Every element must visibly travel from one state to the next (true morphing, not a crossfade). Each state shows a small label naming it ("Bars", "Line", "Donut"), and labels animate in and out.

Requirements:
- Use expressive easing (ease-in-out, overshoot, staggered delays between the 6 elements).
- Dark, modern design with a cohesive colour palette; portrait 4:5 layout, scaled to fit the browser window and centred.
- Motion starts immediately at page load: something is already moving in the first half second.
- Drive all animation with requestAnimationFrame and performance.now; no user interaction needed.
- No other text, titles, buttons or UI beyond the chart labels, values and state labels.

Reply with only the complete HTML file.
How it was made
No transcript was delivered with this result.
Cost breakdown
No cost figure: the run's tokens were never reported, so there is nothing to estimate from.
| Tokens by type | Tokens | $ per 1M | Cost |
|---|---|---|---|
| Input (uncached) | not recorded | n/a | n/a |
| Cache write | not recorded | n/a | n/a |
| Cache read | not recorded | n/a | n/a |
| Output | not recorded | n/a | n/a |
- Total computed from tokens
- unknown
- Total reported by the harness
- none