Algorithm visualizers
11 tests, 47 runs (47 finished). The same prompt for each model, side by side: tap a picture to run the page live.
More
Several algorithms racing side by side on one problem (pathfinding, sorting), one HTML file each: each test's models side by side, live.
11 tests · 47 finished runs (47 agent, 0 raw one-shot) · 47 live demos
Pathfinding race Test page · 8 finished of 8
The prompt (the same for every model)
Build a pathfinding race visualizer: four copies of the same grid maze, side by side (stacked on a phone), where A*, Dijkstra, breadth-first search and greedy best-first search solve the same start-to-goal problem at the same time, step by step. Show each algorithm's frontier, visited cells and final path in distinct colours, and live counters for cells visited, path length and steps taken; when all four finish, show a small results table ranking them and say which found the shortest path and which explored the fewest cells. Controls: generate a new random maze (a perfect maze with some extra openings so paths differ), clear the grid, draw or erase walls by dragging on any grid (the edit applies to all four), move the start and goal by dragging them, a speed slider, play, pause and single step. Diagonal moves are off; every move costs 1. So the page is alive without input, on load it generates a maze and starts the race automatically, and when a race finishes it waits 3 seconds and runs a new maze, forever, until the user touches a control. Make it clear and beautiful, the kind of visual a teacher would put on a projector. Save it as index.html in the current directory: one self-contained file with inline CSS and JavaScript only, no libraries or frameworks, and no external requests of any kind (no CDNs, web fonts, images or audio files). It must work when opened directly from disk, fit any window from a 390 px wide phone to a desktop, and run without console errors. You may serve it locally and open it in headless chromium (/usr/bin/chromium, software WebGL, no GPU) to screenshot and inspect your own output, and iterate on your own before finishing. Close any browser you open as soon as you've taken your screenshot.
Claude Fable 5.1 Claude Code 2.1.280
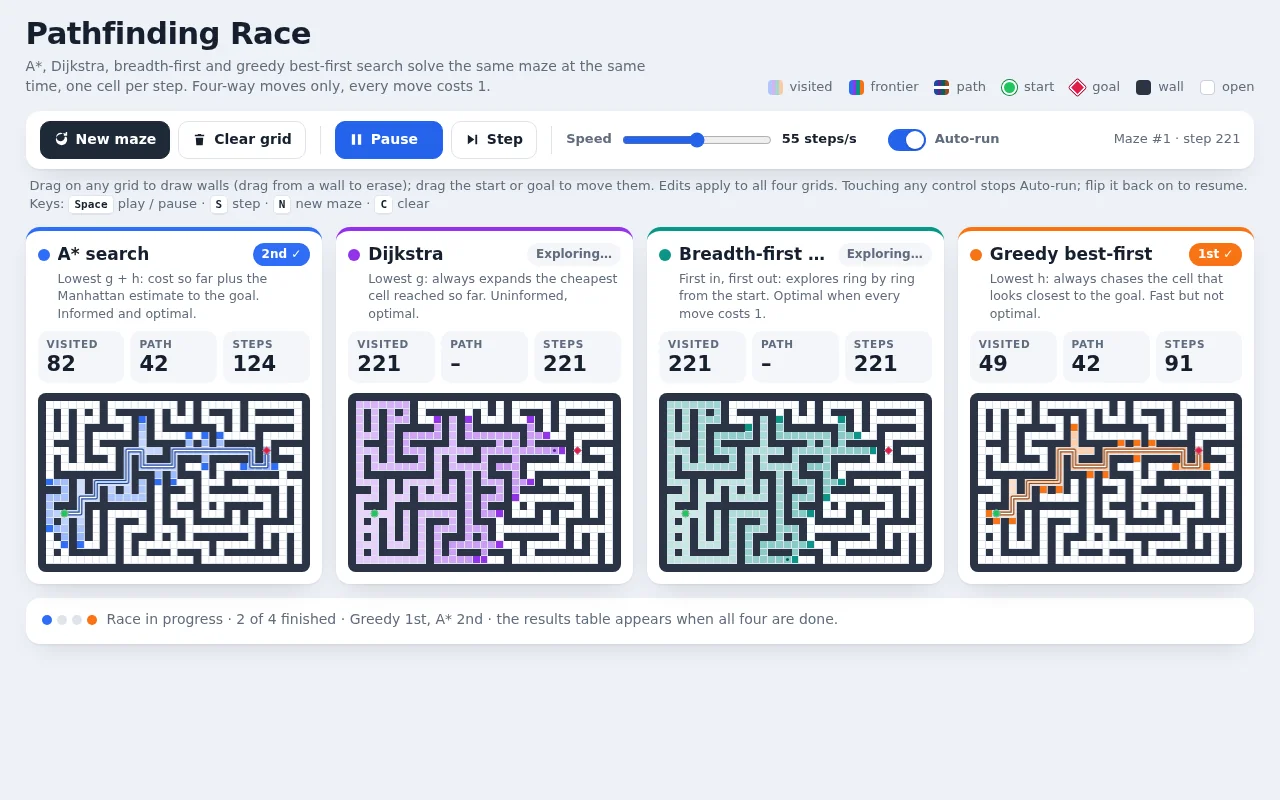
Open the live page in a new tab · Full result: prompt, transcript, cost and time
Claude Haiku 5.5 Claude Code 2.1.280
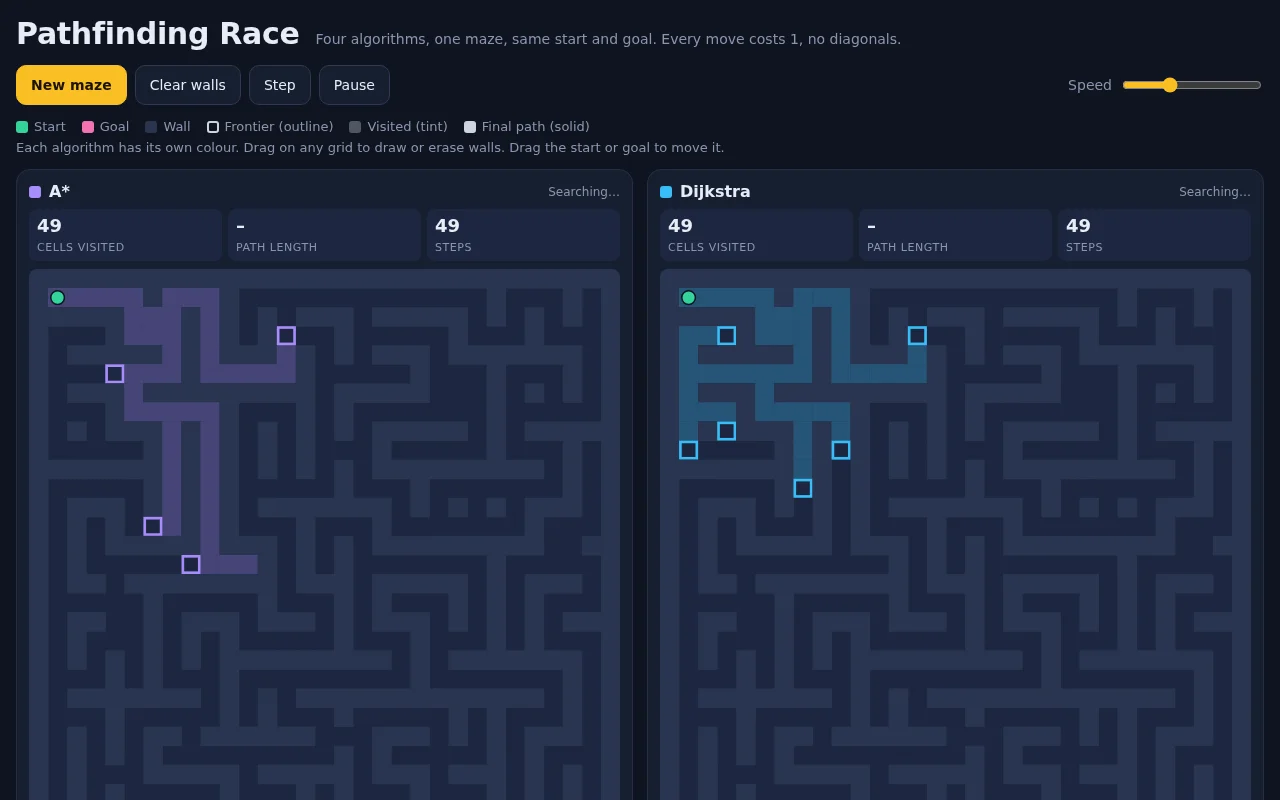
Open the live page in a new tab · Full result: prompt, transcript, cost and time
Claude Opus 5.5 Claude Code 2.1.280
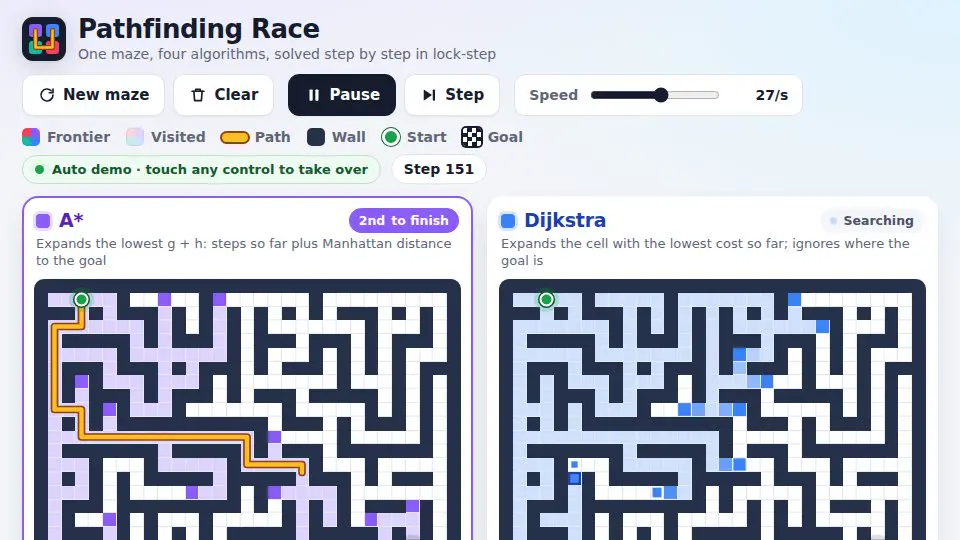
Video: Recorded from the live demo
Open the live page in a new tab · Full result: prompt, transcript, cost and time
Claude Sonnet 5.5 Claude Code 2.1.280
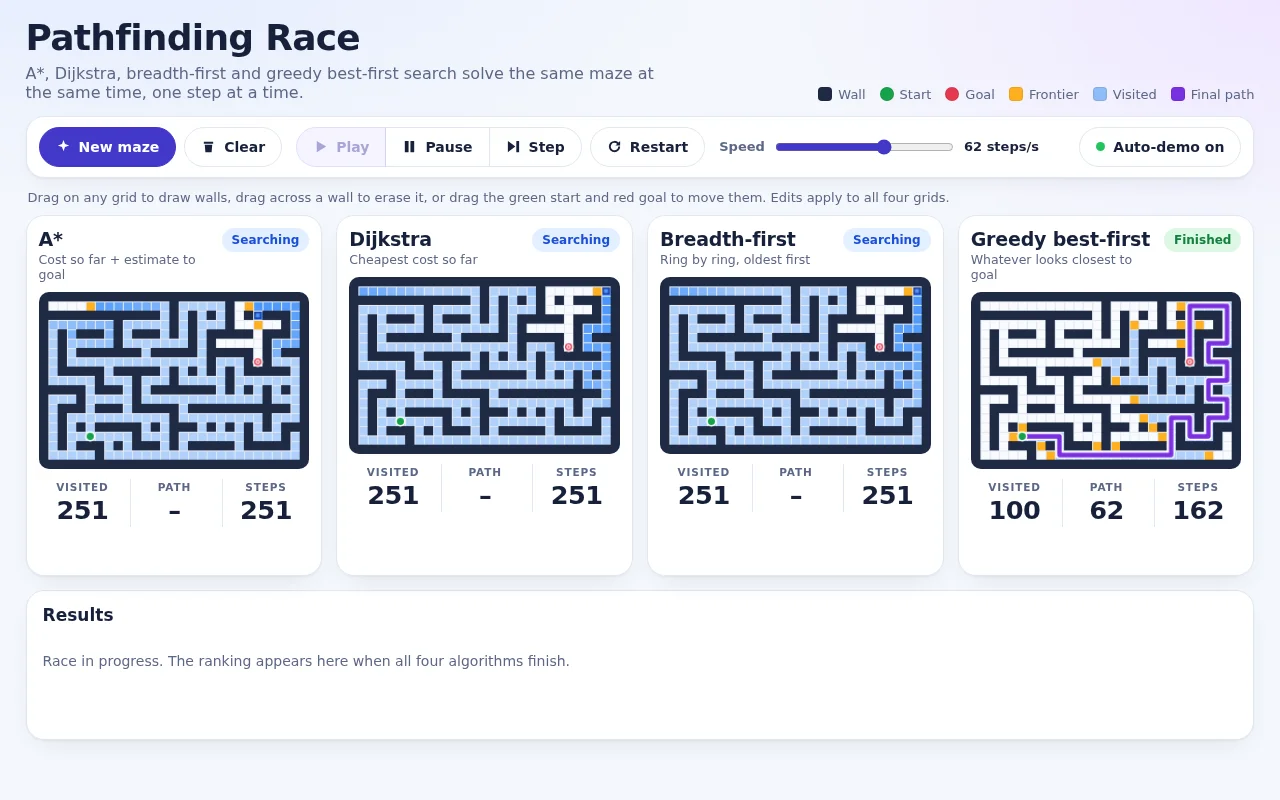
Open the live page in a new tab · Full result: prompt, transcript, cost and time
DeepSeek V4.1 Flash OpenCode 1.18.32
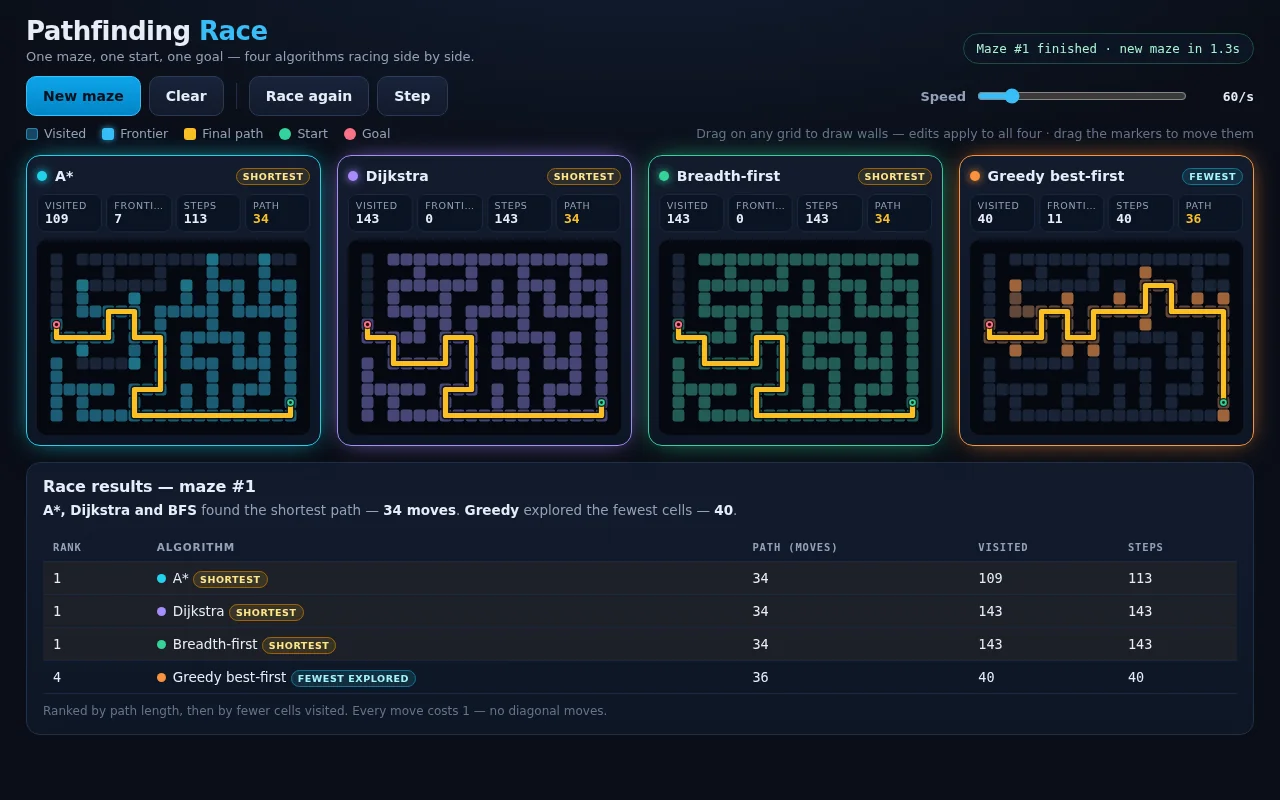
Open the live page in a new tab · Full result: prompt, transcript, cost and time
GPT-6 Astra Codex CLI 0.156.1
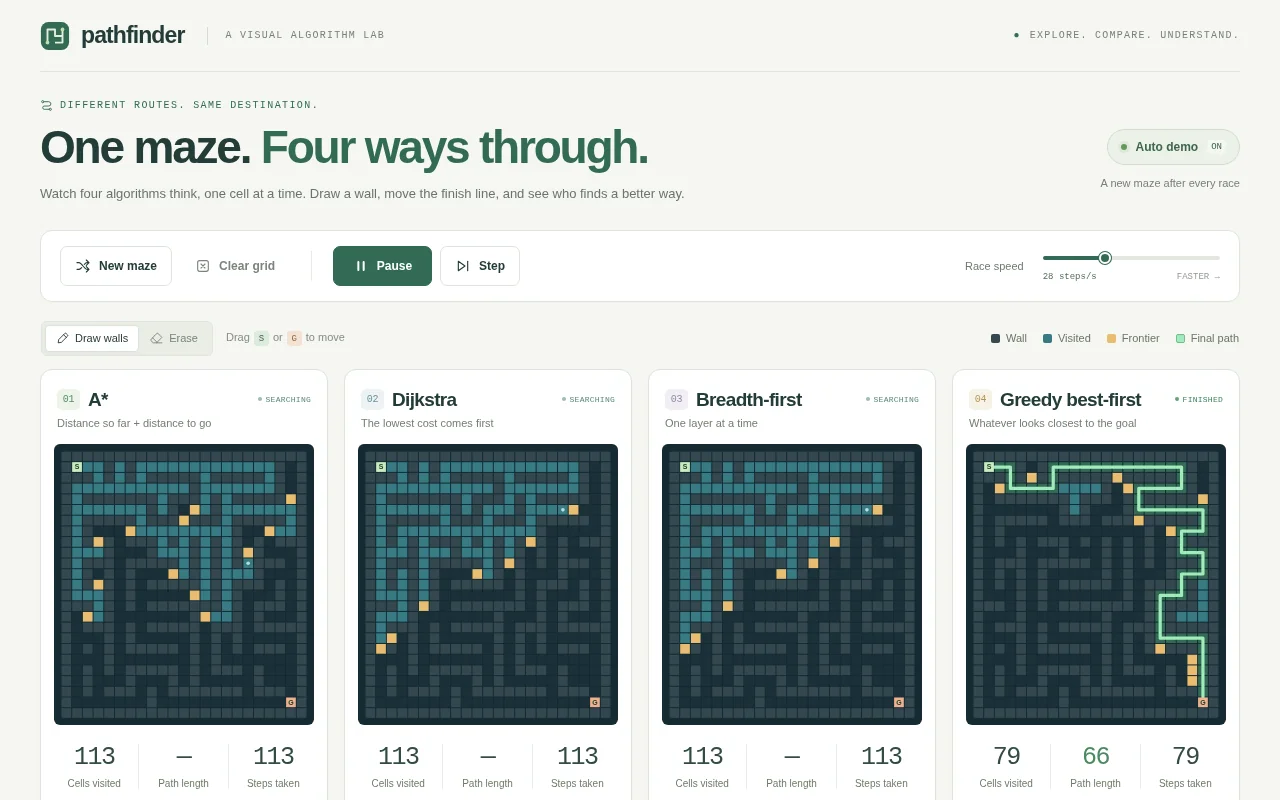
Open the live page in a new tab · Full result: prompt, transcript, cost and time
GPT-6 Astra OpenCode 1.18.32
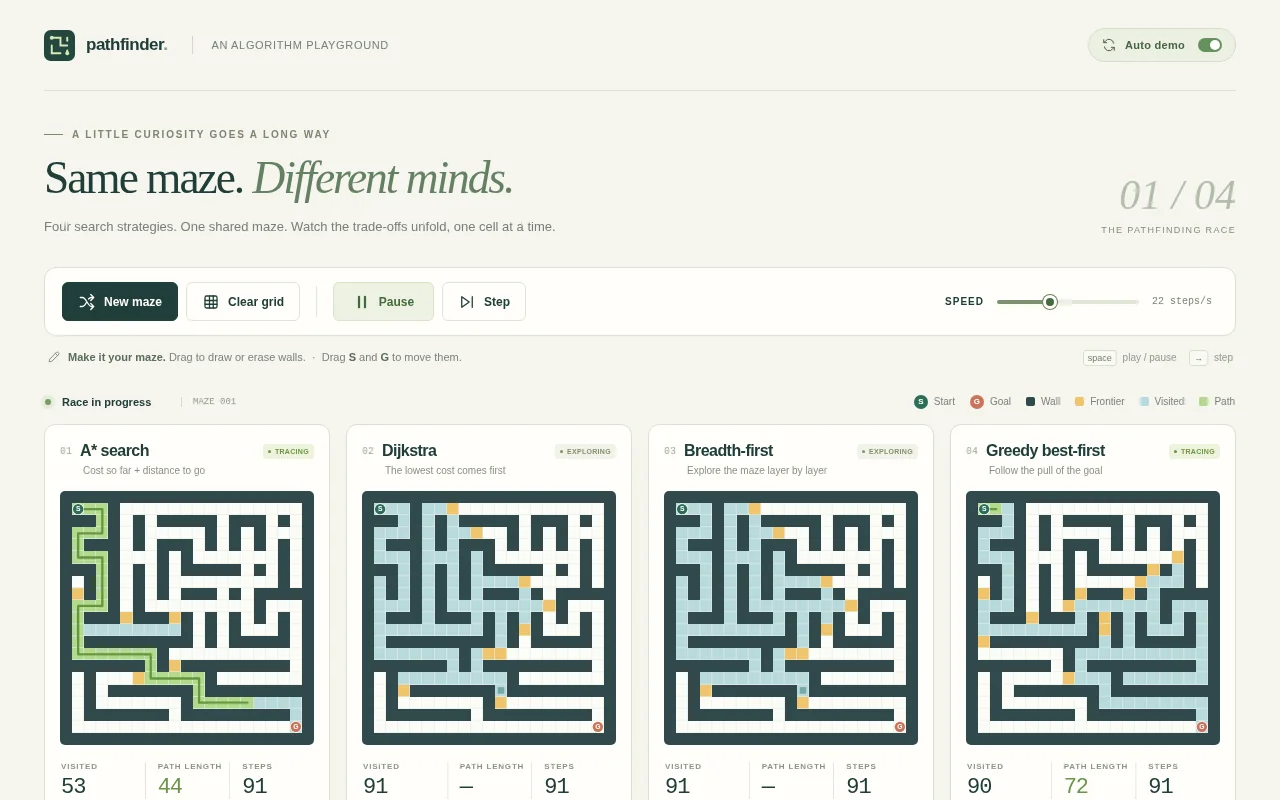
Open the live page in a new tab · Full result: prompt, transcript, cost and time
GPT-6 Sol Codex CLI 0.156.1
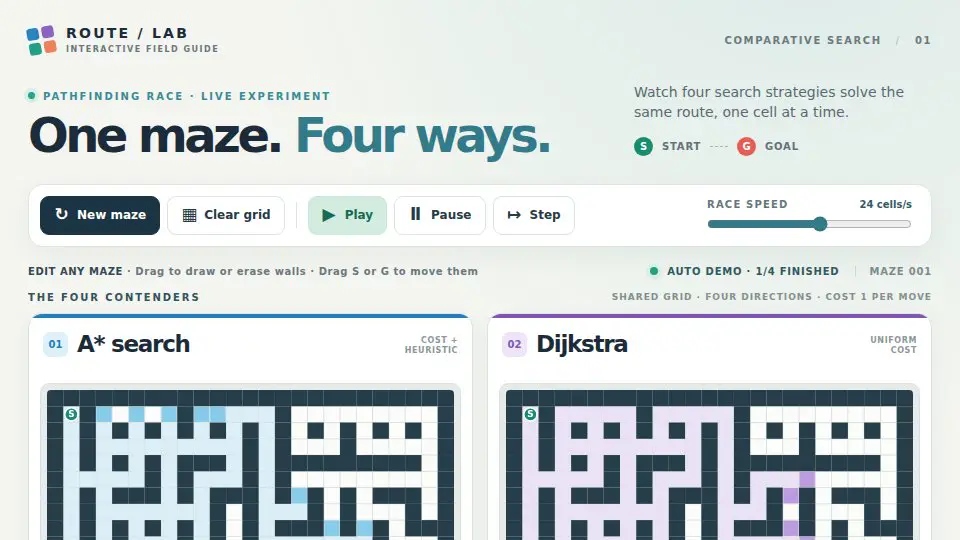
Video: Recorded from the live demo
Open the live page in a new tab · Full result: prompt, transcript, cost and time
Sorting race Test page · 7 finished of 7
The prompt (the same for every model)
Build a sorting algorithm race: six panels side by side (a grid on narrow screens), each sorting its own copy of the same 60-element array drawn as vertical bars, with bubble sort, insertion sort, selection sort, merge sort, quicksort and heapsort running at the same time, one comparison or write per tick. Highlight the bars being compared and the bars being written in each step, and show live counters for comparisons and array writes in every panel. When a panel finishes, play a quick sweep across its bars and stamp its finishing place (1st to 6th). Controls: input presets (random, nearly sorted, reversed, few unique values), a speed slider, play, pause, single step and reset; an optional soft tone per comparison through WebAudio that is off by default, with a mute toggle. After every race, show a small table of comparisons and writes per algorithm for that input. So the page is alive without input, on load it shuffles and starts a race on the random preset automatically, and after each finish it waits 3 seconds and races the next preset in turn, forever, until the user touches a control. Make it clear and beautiful, the kind of visual a teacher would put on a projector. Save it as index.html in the current directory: one self-contained file with inline CSS and JavaScript only, no libraries or frameworks, and no external requests of any kind (no CDNs, web fonts, images or audio files). It must work when opened directly from disk, fit any window from a 390 px wide phone to a desktop, and run without console errors. You may serve it locally and open it in headless chromium (/usr/bin/chromium, software WebGL, no GPU) to screenshot and inspect your own output, and iterate on your own before finishing. Close any browser you open as soon as you've taken your screenshot.
Claude Haiku 5.5 Claude Code 2.1.280
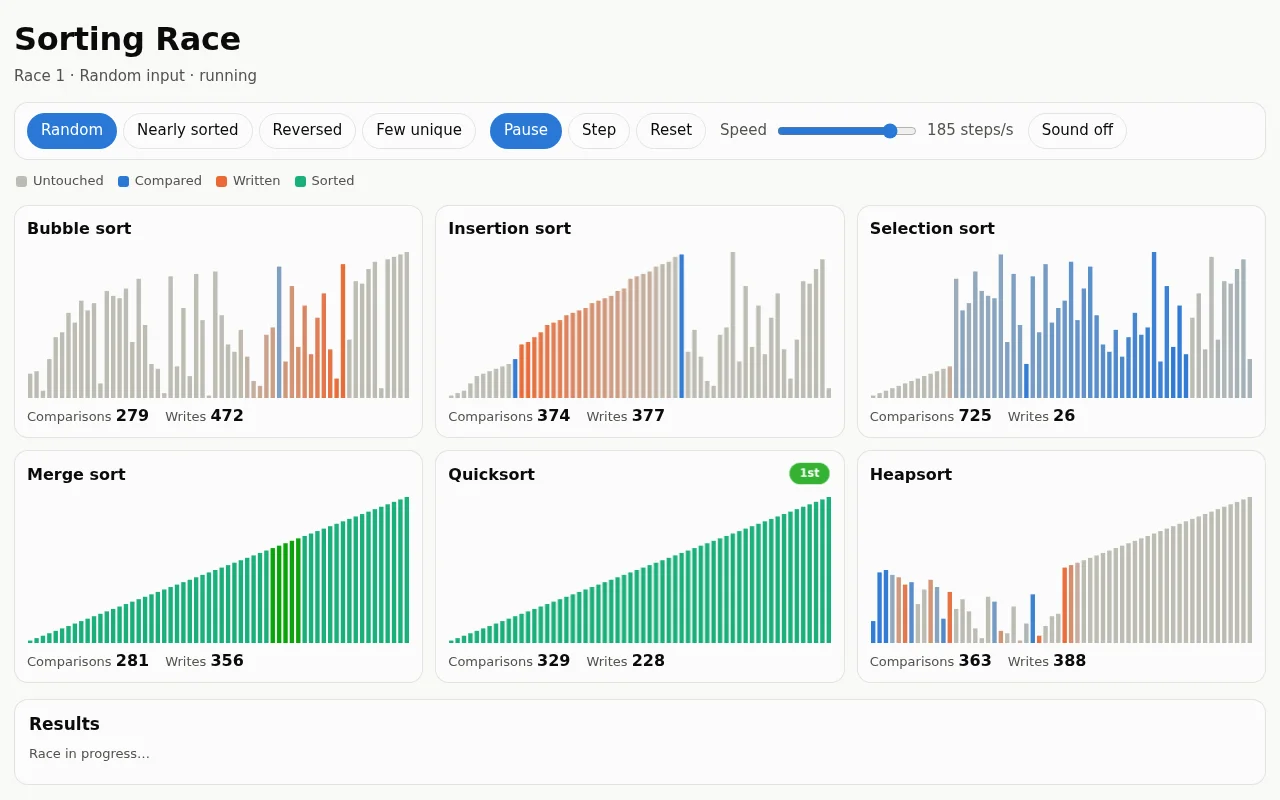
Open the live page in a new tab · Full result: prompt, transcript, cost and time
Claude Opus 5.5 Claude Code 2.1.280
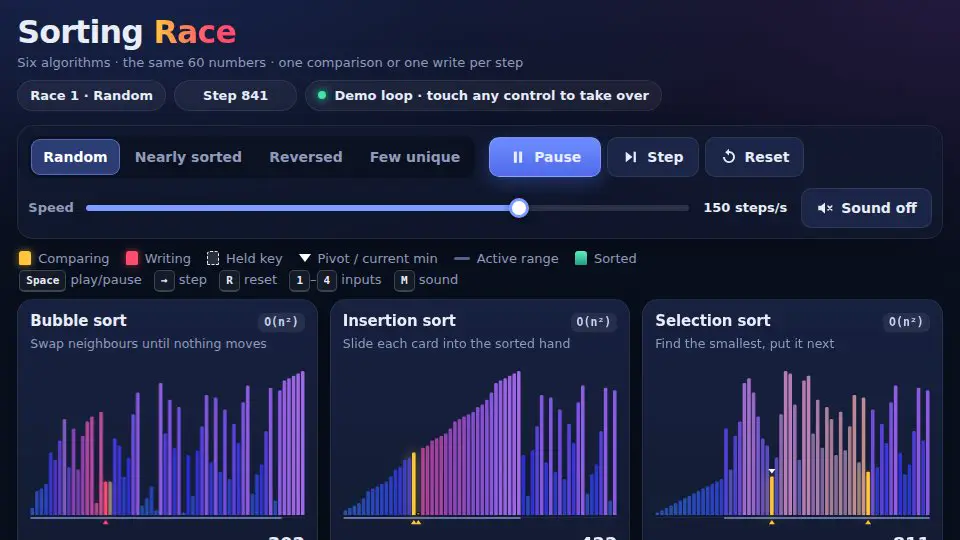
Video: Recorded from the live demo
Open the live page in a new tab · Full result: prompt, transcript, cost and time
Claude Sonnet 5.5 Claude Code 2.1.280
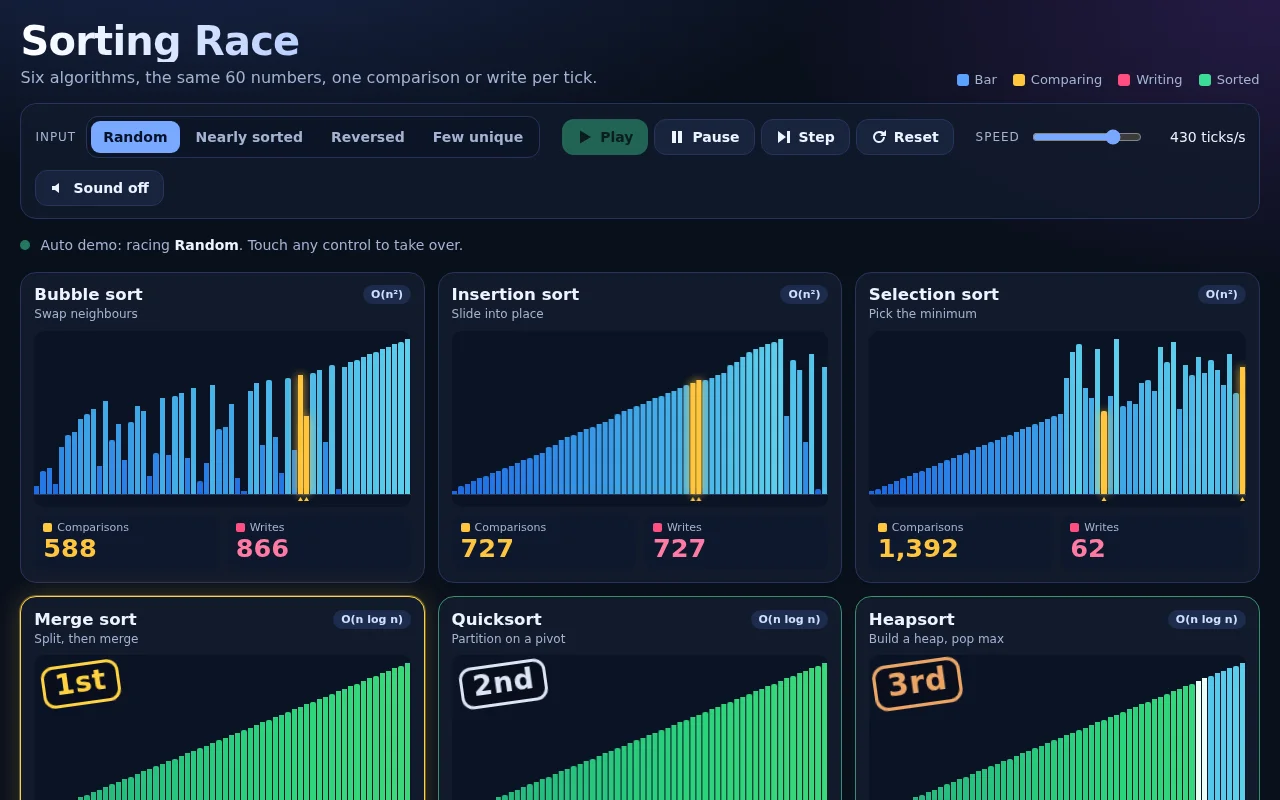
Open the live page in a new tab · Full result: prompt, transcript, cost and time
DeepSeek V4.1 Flash OpenCode 1.18.32
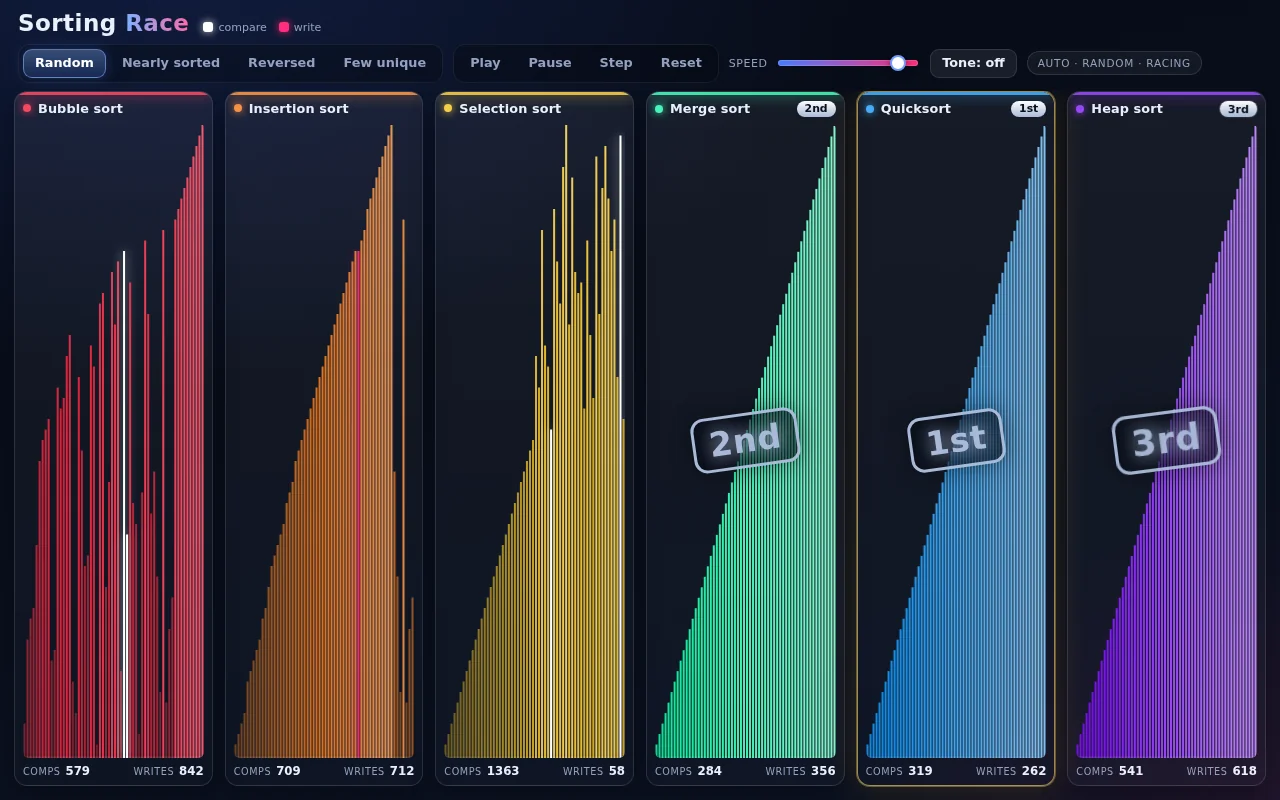
Open the live page in a new tab · Full result: prompt, transcript, cost and time
GPT-6 Astra Codex CLI 0.156.1
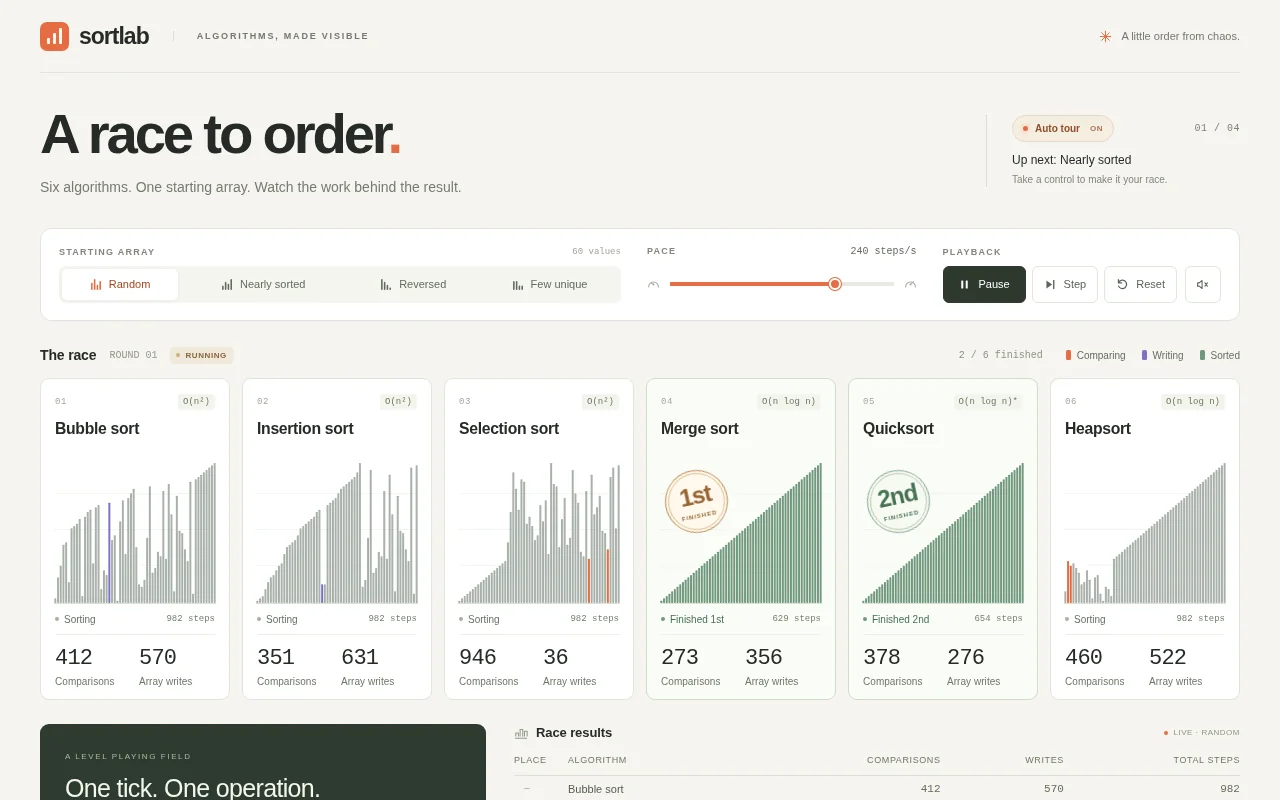
Open the live page in a new tab · Full result: prompt, transcript, cost and time
GPT-6 Astra OpenCode 1.18.32
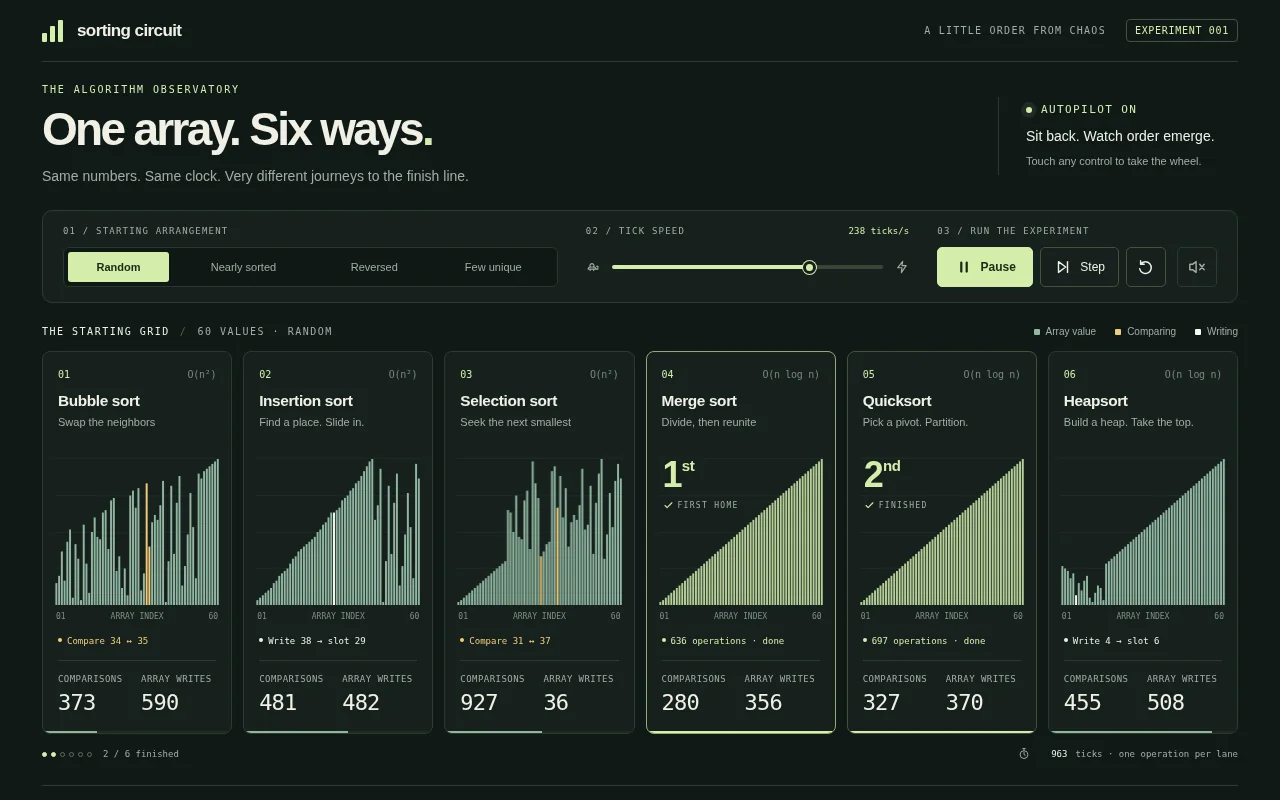
Open the live page in a new tab · Full result: prompt, transcript, cost and time
GPT-6 Sol Codex CLI 0.156.1
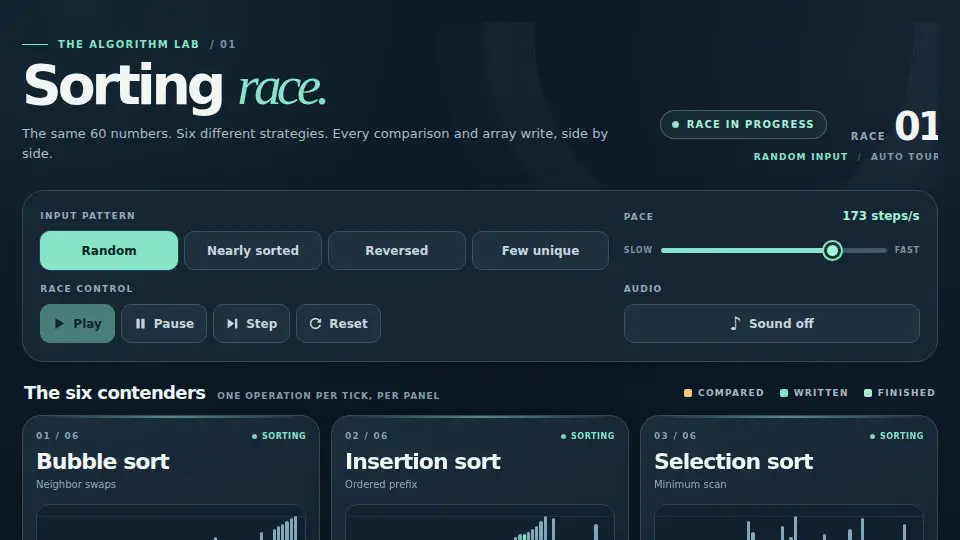
Video: Recorded from the live demo
Open the live page in a new tab · Full result: prompt, transcript, cost and time
Balanced trees Test page · 3 finished of 3
The prompt (the same for every model)
Build a balanced search tree visualizer: three trees side by side (stacked on narrow screens) receive the same sequence of integer keys at the same time: an AVL tree, a red-black tree and a B-tree of order 4 (2-3-4 tree). Insert one key per step and animate every structural change honestly: nodes sliding to new positions, AVL single and double rotations with the pivot highlighted and balance factors shown on each node, red-black recolouring and rotations with node colours, B-tree node splits with the middle key rising to the parent. Lay each tree out cleanly so it never overlaps, and scale to fit its panel as it grows. Show height, node count, rotations or splits so far, and the number of comparisons for the last operation in every panel. After 25 inserts, perform 8 deletions with their own rebalancing animations, then search for 4 keys showing the comparison path. Controls: key sequence presets (random, ascending 1..31 which wrecks a naive tree, alternating zig-zag, few repeats), type a key to insert, delete or search, speed slider, play, pause, step, reset. So the page is alive without input, on load it runs the random preset automatically, then waits 3 seconds and runs the next preset, forever, until the user touches a control. Make it elegant, with smooth motion that makes rotations finally make sense. Save it as index.html in the current directory: one self-contained file with inline CSS and JavaScript only, no libraries or frameworks, and no external requests of any kind (no CDNs, web fonts, images or audio files). It must work when opened directly from disk, fit any window from a 390 px wide phone to a desktop, and run without console errors. You may serve it locally and open it in headless chromium (/usr/bin/chromium, software WebGL, no GPU) to screenshot and inspect your own output, and iterate on your own before finishing. Close any browser you open as soon as you've taken your screenshot.
DeepSeek V4.1 Flash OpenCode 1.18.32
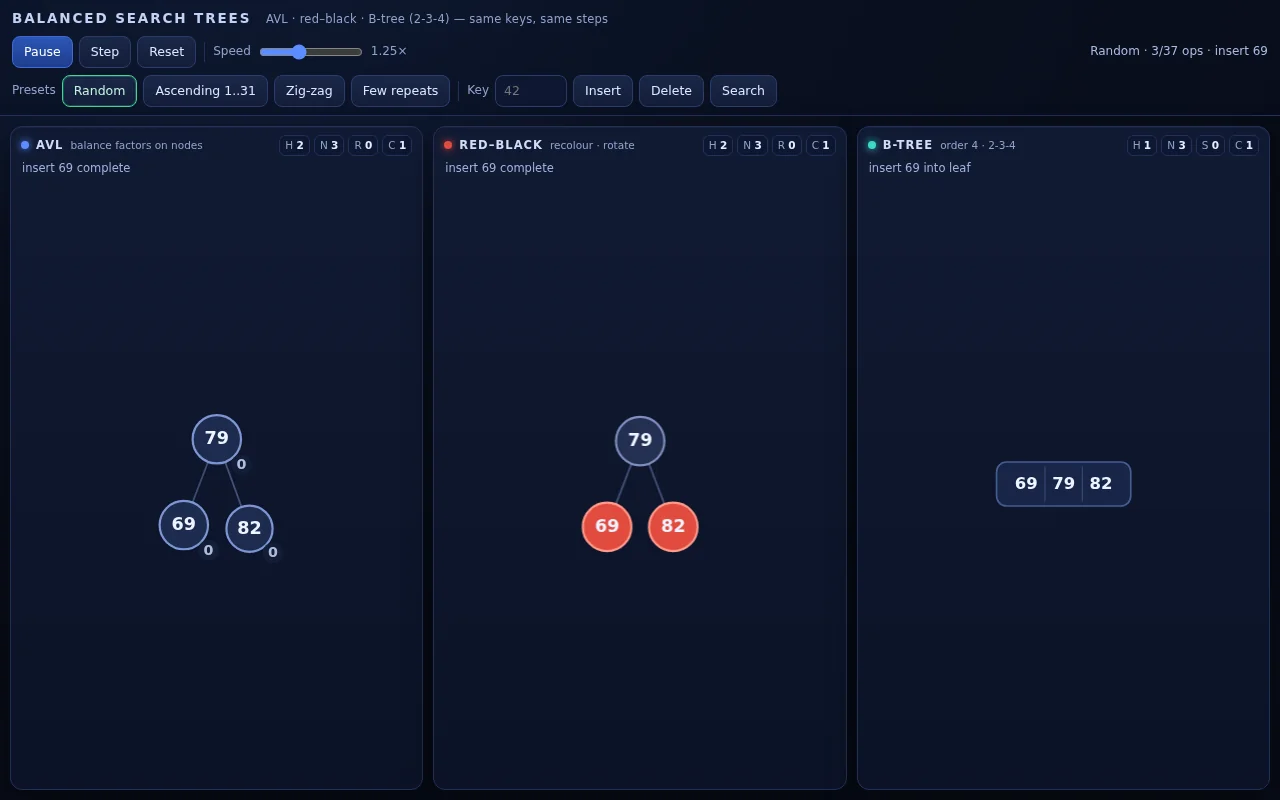
Open the live page in a new tab · Full result: prompt, transcript, cost and time
GPT-6 Astra Codex CLI 0.156.1
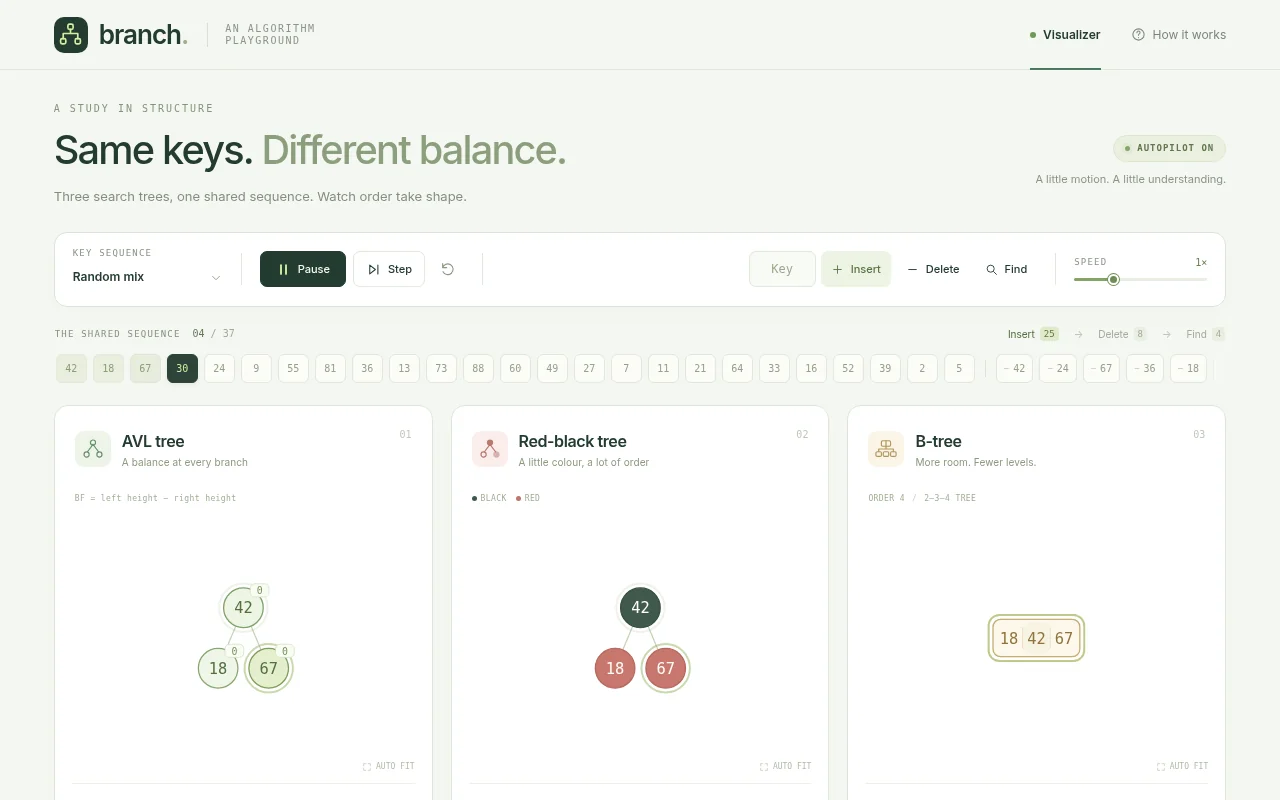
Open the live page in a new tab · Full result: prompt, transcript, cost and time
GPT-6 Sol Codex CLI 0.156.1
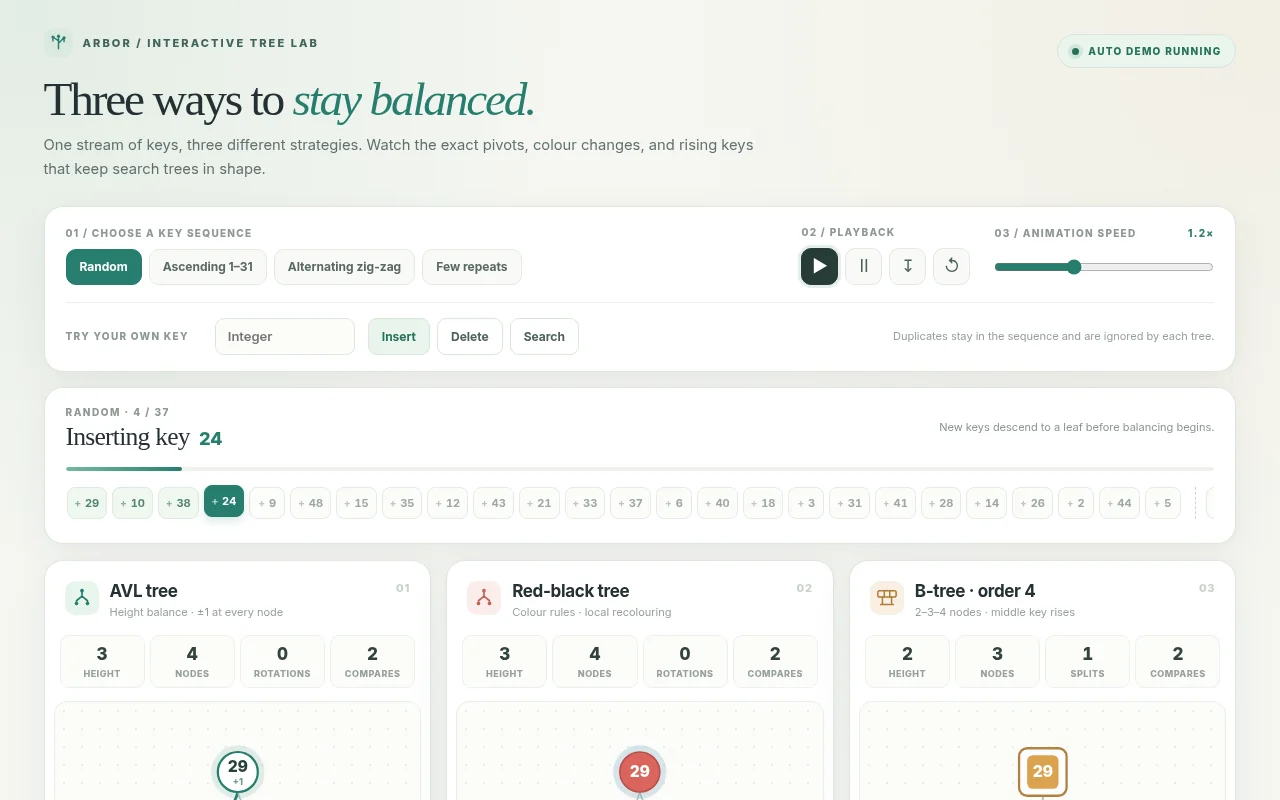
Open the live page in a new tab · Full result: prompt, transcript, cost and time
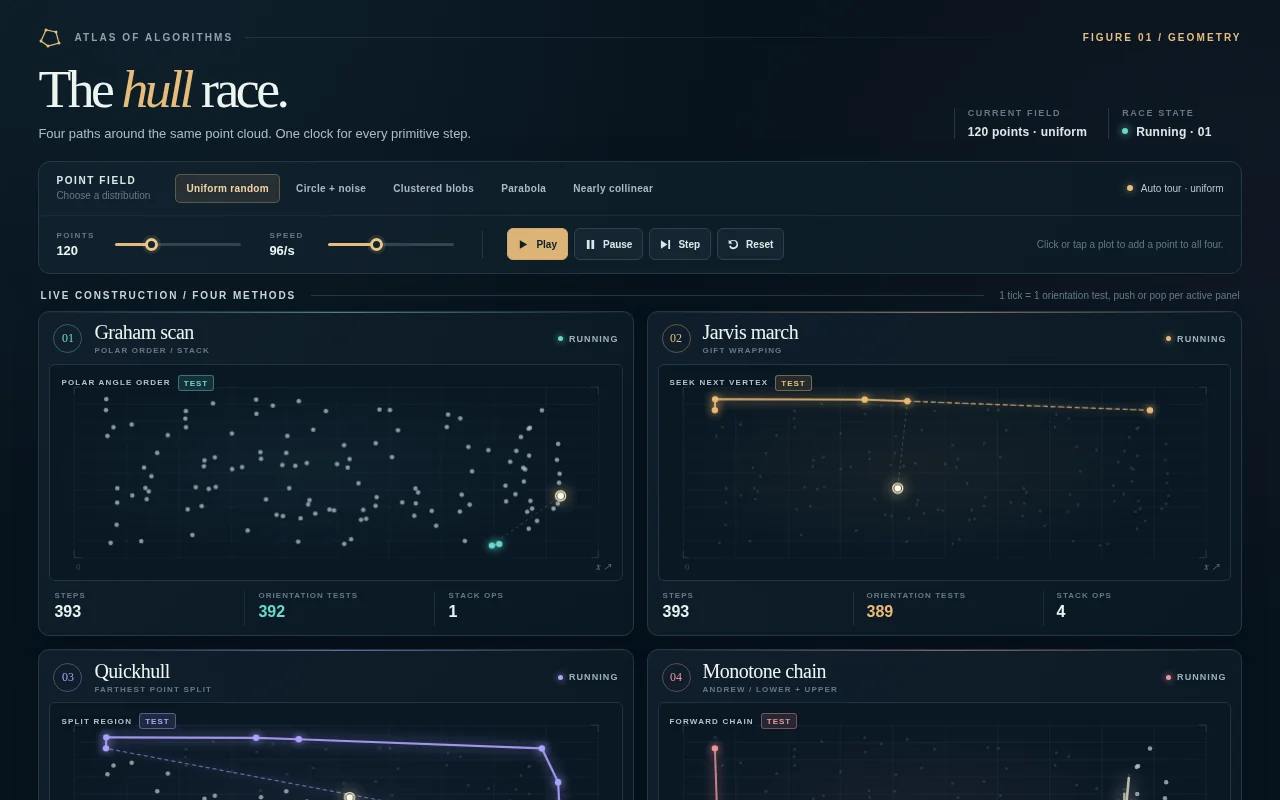
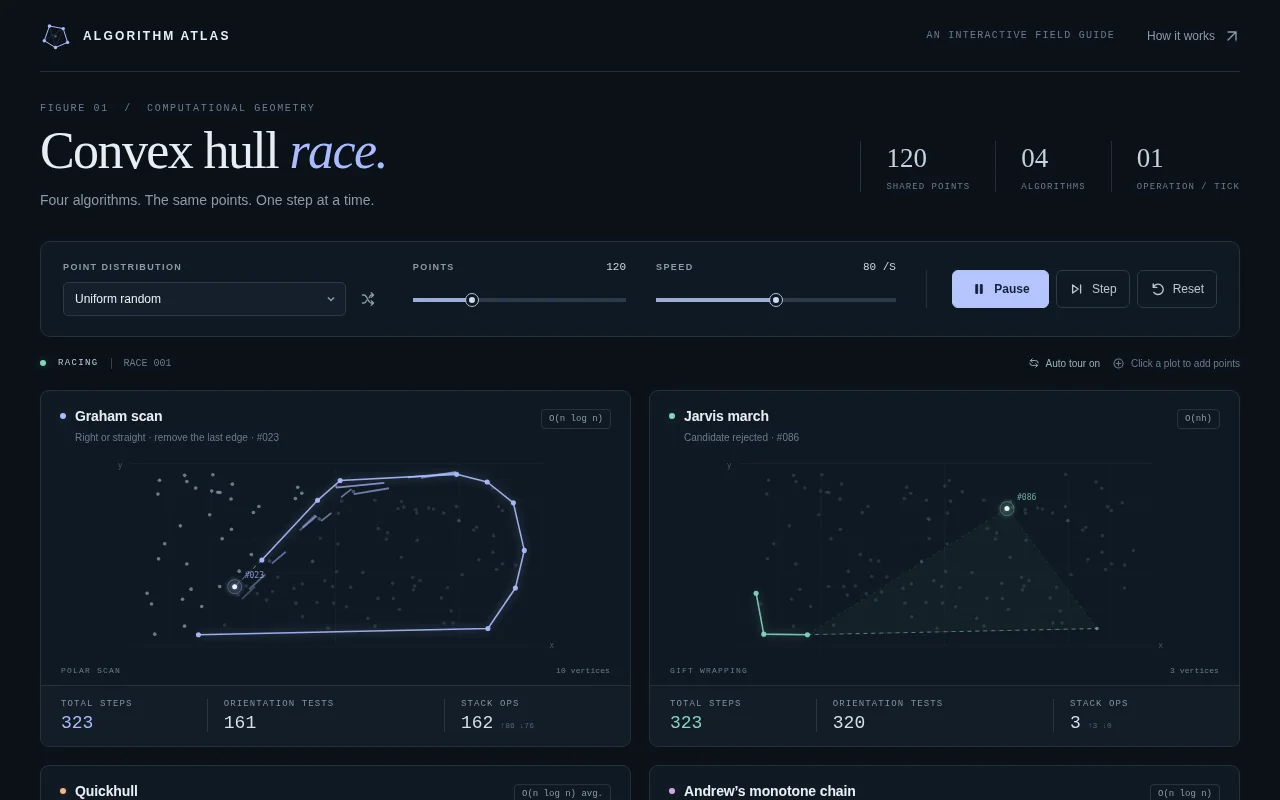
Convex hull race Test page · 4 finished of 4
The prompt (the same for every model)
Build a convex hull algorithm race: four panels (a 2 x 2 grid, stacked on narrow screens) each run a different algorithm on its own copy of the same cloud of 120 random points: Graham scan, Jarvis march (gift wrapping), Quickhull and Andrew's monotone chain. Advance every panel one primitive step per tick (one orientation test, one push or one pop) so the speeds are honestly comparable. Draw the candidate hull growing as glowing edges, flash the point being tested, show rejected points dimming, animate stack pops as edges snapping away, and keep a live counter of orientation tests and stack operations per panel. When a panel finishes, fill its hull with a soft gradient, sweep a highlight around the perimeter and stamp its finishing place. Controls: point-set presets (uniform random, circle with noise, clustered blobs, points on a parabola, nearly collinear), a point-count slider (20 to 400), click or tap to add points, speed slider, play, pause, single step and reset. After each race show a small results table (steps, orientation tests, hull size). So the page is alive without input, on load it starts racing the uniform preset automatically, and after each finish it waits 3 seconds and races the next preset in turn, forever, until the user touches a control. Make it precise and beautiful, like a figure from a great algorithms textbook brought to life. Save it as index.html in the current directory: one self-contained file with inline CSS and JavaScript only, no libraries or frameworks, and no external requests of any kind (no CDNs, web fonts, images or audio files). It must work when opened directly from disk, fit any window from a 390 px wide phone to a desktop, and run without console errors. You may serve it locally and open it in headless chromium (/usr/bin/chromium, software WebGL, no GPU) to screenshot and inspect your own output, and iterate on your own before finishing. Close any browser you open as soon as you've taken your screenshot.
Claude Opus 5.5 Claude Code 2.1.280
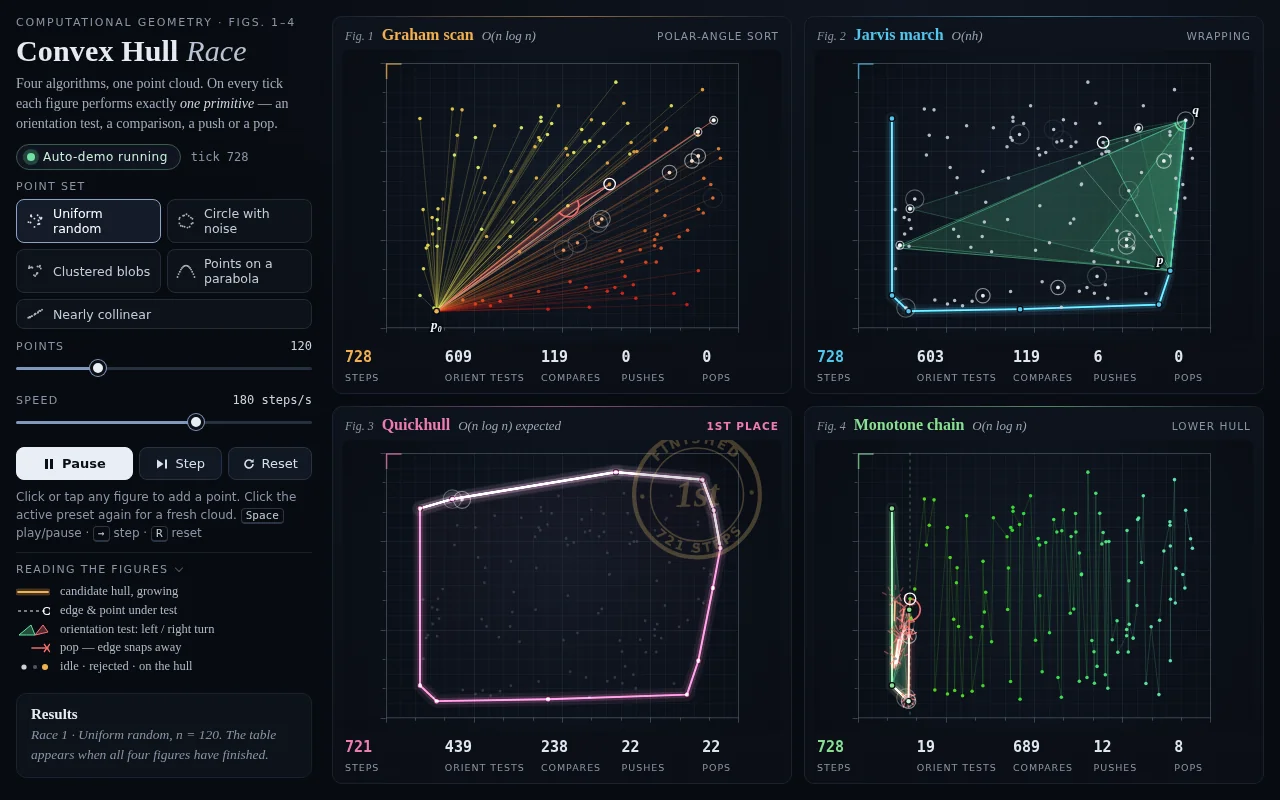
Open the live page in a new tab · Full result: prompt, transcript, cost and time
Claude Sonnet 5.5 Claude Code 2.1.280
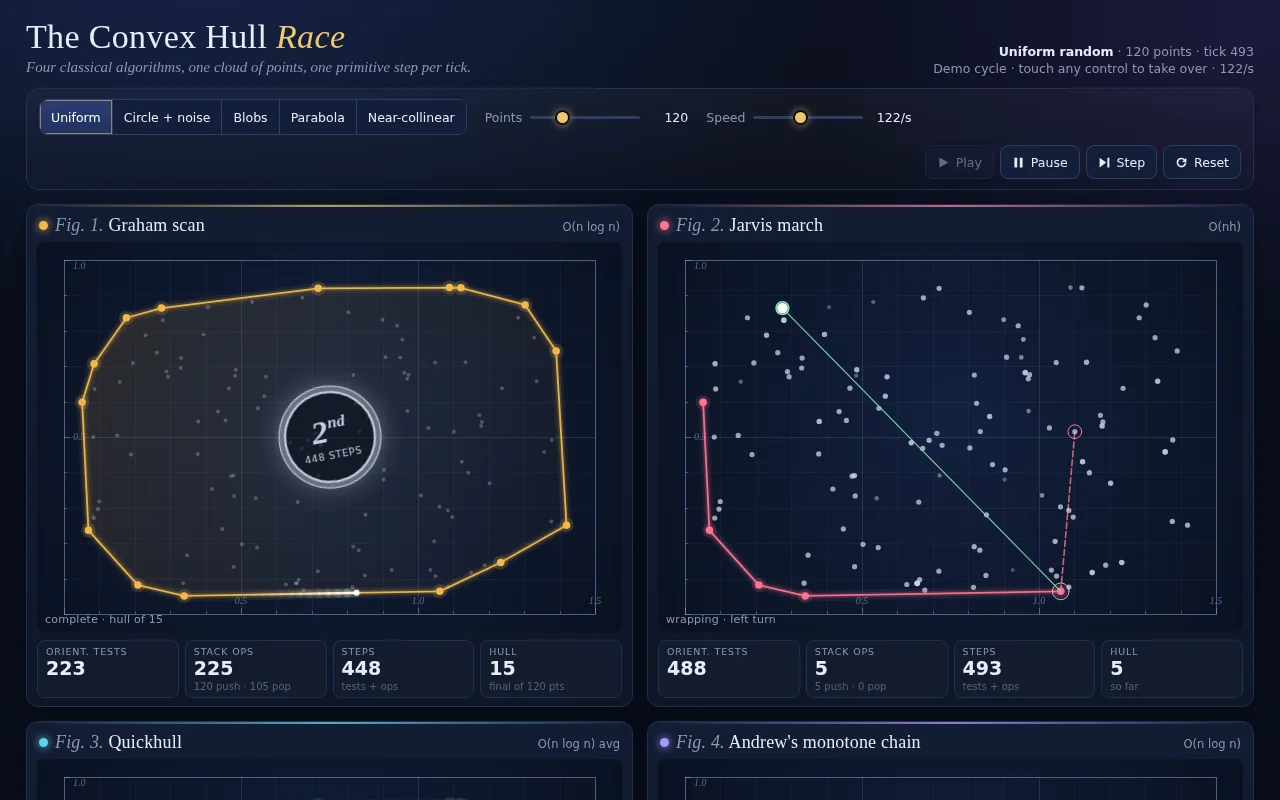
Open the live page in a new tab · Full result: prompt, transcript, cost and time
GPT-6 Sol Codex CLI 0.156.1
Open the live page in a new tab · Full result: prompt, transcript, cost and time
gpt-6.1-sol Codex CLI 0.156.1
Open the live page in a new tab · Full result: prompt, transcript, cost and time
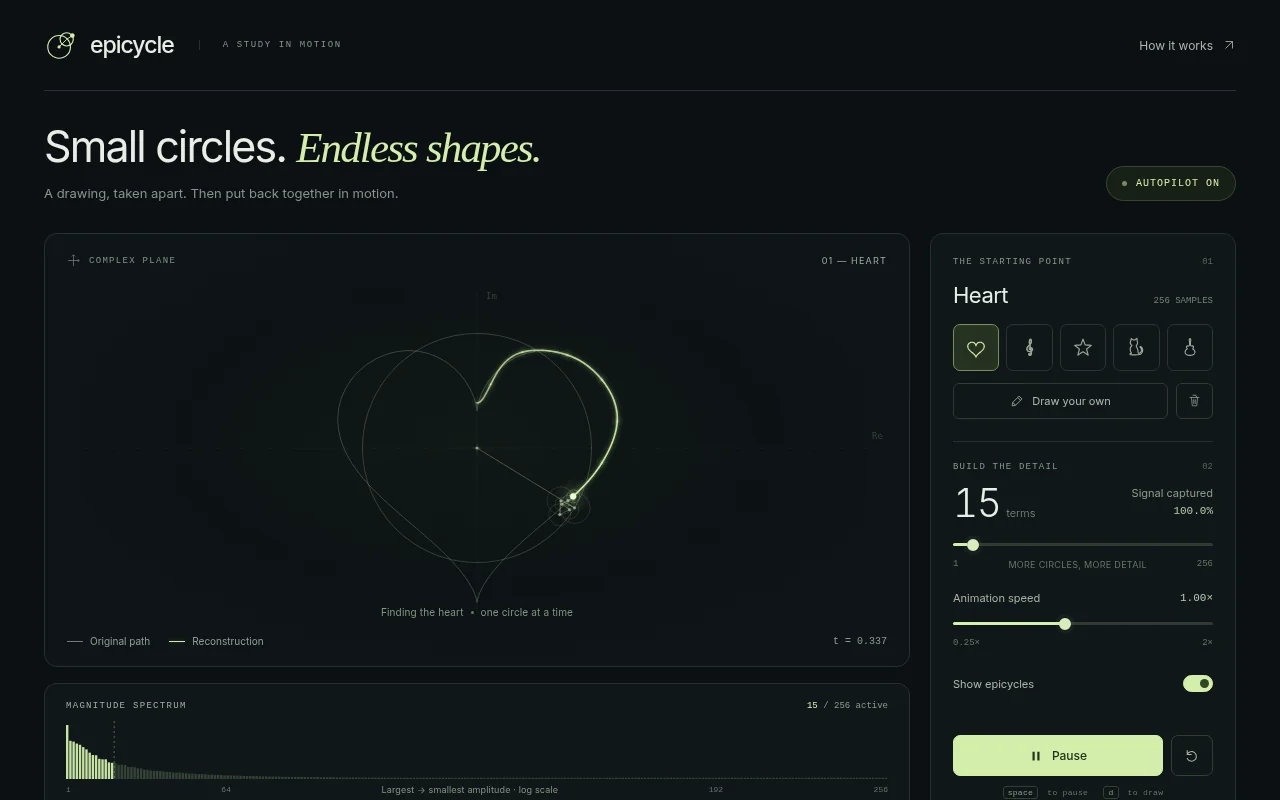
Fourier epicycles Test page · 1 finished of 1
The prompt (the same for every model)
Build a Fourier epicycles visualizer that shows how the discrete Fourier transform rebuilds a drawing from rotating circles. Start from a closed path (presets: a heart, a treble clef, a five-pointed star, a cat silhouette and the outline of a guitar, each defined as point lists in code), resample it to 256 evenly spaced points, compute the DFT yourself in JavaScript, and draw the epicycles: a chain of circles sorted from largest to smallest, each rotating at its frequency, with the tip tracing the reconstructed path as a glowing trail that fades over time. Show the original path faintly underneath so viewers can compare. A slider sets how many terms are used (1 to 256), and the reconstruction updates live so people can watch the shape sharpen as terms are added; a small bar chart shows the magnitude spectrum with the active terms highlighted. Let the user draw their own closed shape with the mouse or a finger and then watch it transformed. Controls: preset picker, term slider, speed slider, play, pause, show or hide circles, clear and draw. So the page is alive without input, on load it plays the heart while slowly sweeping the term count from 1 up to 128, then moves to the next preset after one full drawing, forever, until the user touches a control. Make it mesmerizing, dark background, crisp thin lines and luminous trails. Save it as index.html in the current directory: one self-contained file with inline CSS and JavaScript only, no libraries or frameworks, and no external requests of any kind (no CDNs, web fonts, images or audio files). It must work when opened directly from disk, fit any window from a 390 px wide phone to a desktop, and run without console errors. You may serve it locally and open it in headless chromium (/usr/bin/chromium, software WebGL, no GPU) to screenshot and inspect your own output, and iterate on your own before finishing. Close any browser you open as soon as you've taken your screenshot.
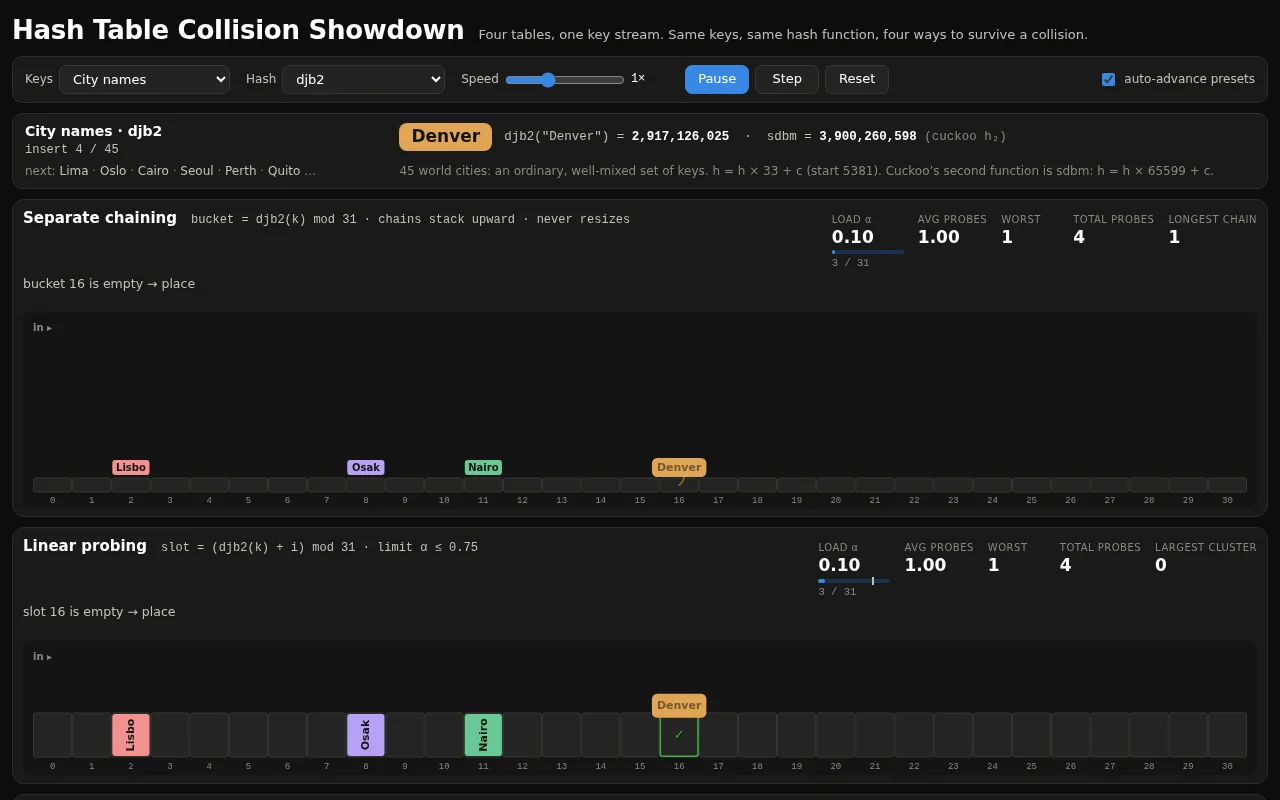
Hash table showdown Test page · 5 finished of 5
The prompt (the same for every model)
Build a hash table collision showdown: four hash tables of 31 buckets each receive the same stream of string keys (words like city names) at the same time, one insert per tick, using separate chaining, linear probing, quadratic probing and cuckoo hashing with two tables. Show each key flying in, the computed hash value as a number, every probe step as a hop between buckets, chains growing as stacks, clusters forming in linear probing (highlight primary clusters), and cuckoo evictions as keys being kicked out and flying to their alternate slot. Each panel shows live load factor, average and worst probe count, and total probes. When a table passes its load-factor limit (0.75 for open addressing, 0.9 for cuckoo, chaining never), animate a resize to the next prime size with every key re-hashed into place. Every 20 inserts, run a burst of 10 lookups (half present, half missing) and show their probe paths. Controls: key stream presets (city names, sequential numbers as strings, adversarial keys that collide under the default hash), choice of hash function (djb2, FNV-1a, a deliberately bad sum-of-chars), speed slider, play, pause, step, reset. So the page is alive without input, on load it starts streaming the city names automatically and after the stream finishes it waits 3 seconds and moves to the next preset, forever, until the user touches a control. Make it clear enough to teach and pretty enough to watch. Save it as index.html in the current directory: one self-contained file with inline CSS and JavaScript only, no libraries or frameworks, and no external requests of any kind (no CDNs, web fonts, images or audio files). It must work when opened directly from disk, fit any window from a 390 px wide phone to a desktop, and run without console errors. You may serve it locally and open it in headless chromium (/usr/bin/chromium, software WebGL, no GPU) to screenshot and inspect your own output, and iterate on your own before finishing. Close any browser you open as soon as you've taken your screenshot.
Claude Fable 5.1 Claude Code 2.1.280
Open the live page in a new tab · Full result: prompt, transcript, cost and time
DeepSeek V4.1 Flash OpenCode 1.18.32
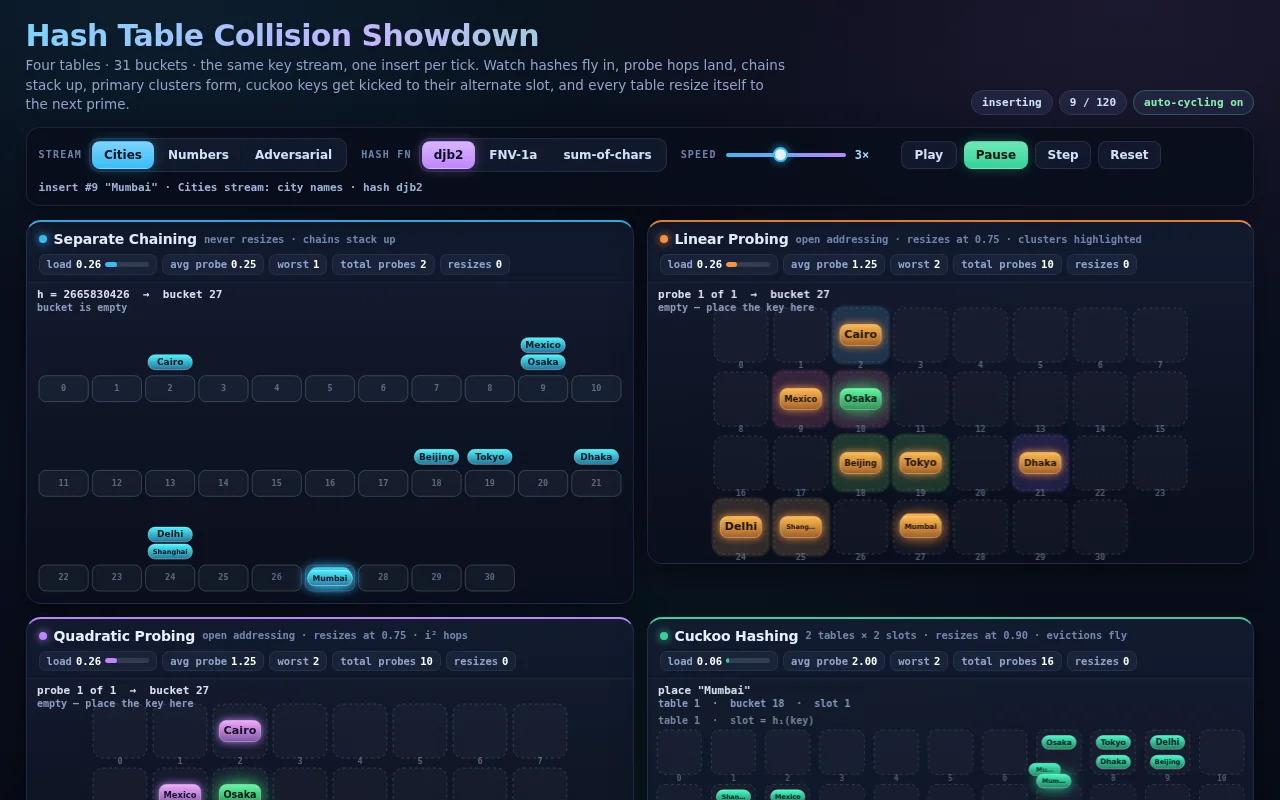
Open the live page in a new tab · Full result: prompt, transcript, cost and time
GPT-6 Astra Codex CLI 0.156.1
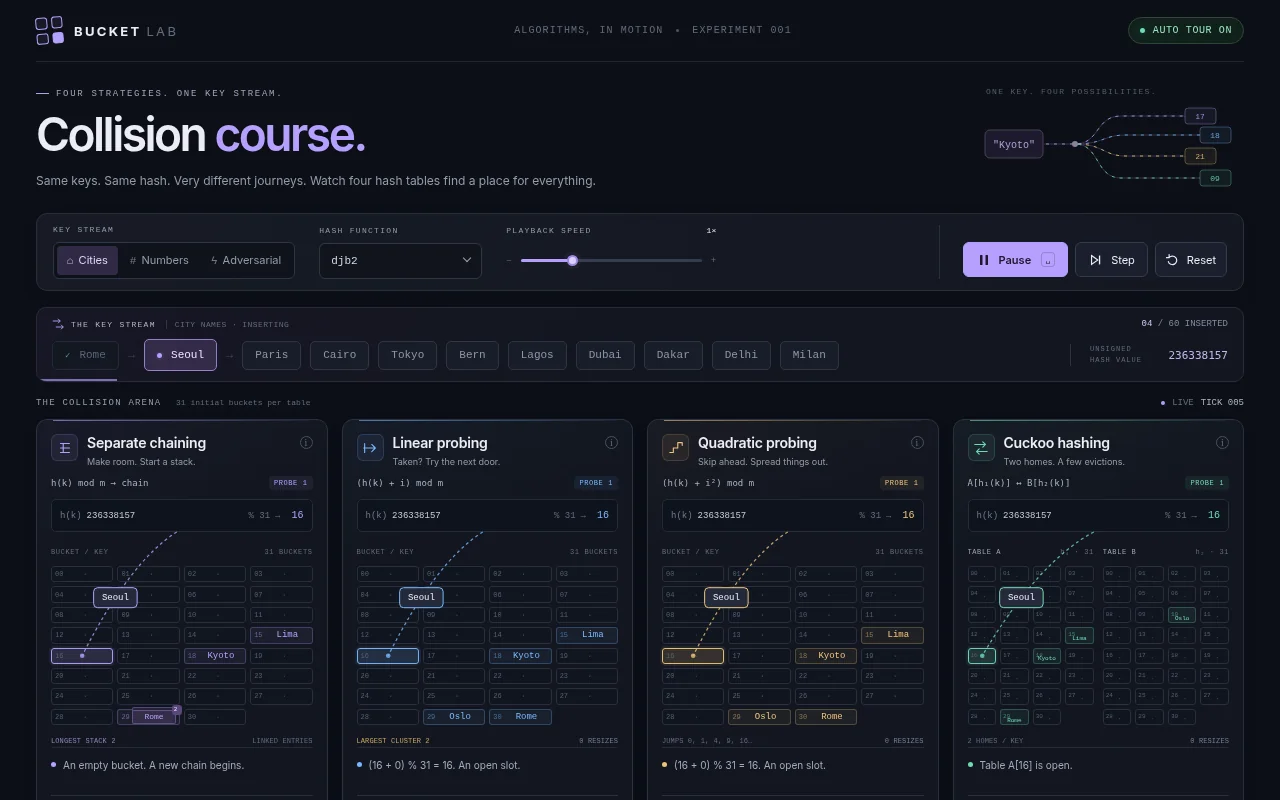
Open the live page in a new tab · Full result: prompt, transcript, cost and time
GPT-6 Sol Codex CLI 0.156.1

Open the live page in a new tab · Full result: prompt, transcript, cost and time
gpt-6.1-sol Codex CLI 0.156.1
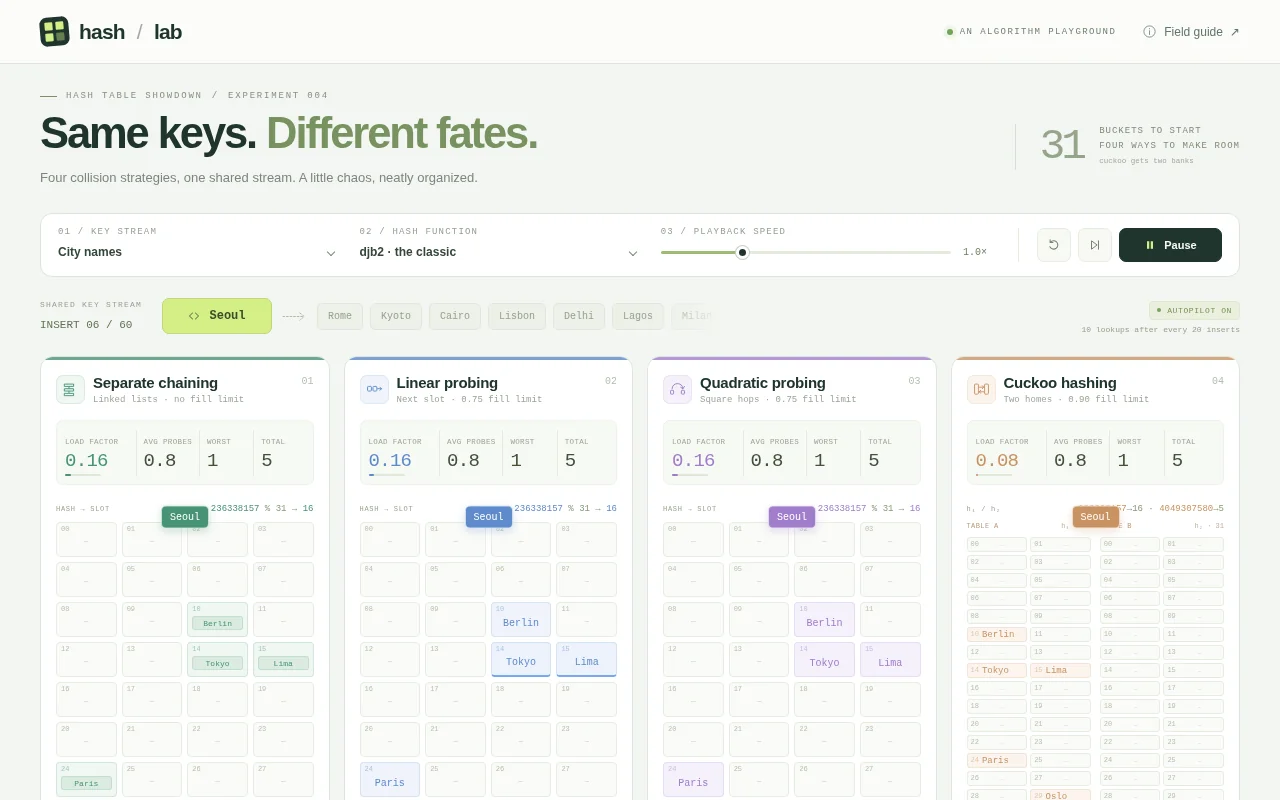
Open the live page in a new tab · Full result: prompt, transcript, cost and time
Maze generate and solve Test page · 7 finished of 7
The prompt (the same for every model)
Build a maze generation and solving show: four panels side by side (a grid on narrow screens) each carve the same-size 31 x 21 maze with a different generator at the same time: recursive backtracker (depth-first), randomized Prim's, randomized Kruskal's with union-find, and Wilson's loop-erased random walk. Show each generator's working state honestly: the backtracker's stack as a glowing trail, Prim's frontier cells, Kruskal's sets as distinct colours that merge as walls fall, Wilson's wandering walk with its loops being erased. Count steps per panel. When a maze is complete, solve it in the same panel with A* from the top-left to the bottom-right corner, drawing the open set, the closed set and the final path as a bright line, and show path length and cells explored. Then display a small comparison (generation steps, dead ends, longest corridor, solution length) so viewers see how the generators produce different textures of maze. Controls: maze size presets, speed slider, play, pause, single step, regenerate, and a toggle to solve with breadth-first search instead of A*. So the page is alive without input, on load it generates and solves automatically, then waits 3 seconds and starts a new round with a fresh seed, forever, until the user touches a control. Make it feel like a calm, hypnotic museum installation. Save it as index.html in the current directory: one self-contained file with inline CSS and JavaScript only, no libraries or frameworks, and no external requests of any kind (no CDNs, web fonts, images or audio files). It must work when opened directly from disk, fit any window from a 390 px wide phone to a desktop, and run without console errors. You may serve it locally and open it in headless chromium (/usr/bin/chromium, software WebGL, no GPU) to screenshot and inspect your own output, and iterate on your own before finishing. Close any browser you open as soon as you've taken your screenshot.
Claude Fable 5.1 Claude Code 2.1.280
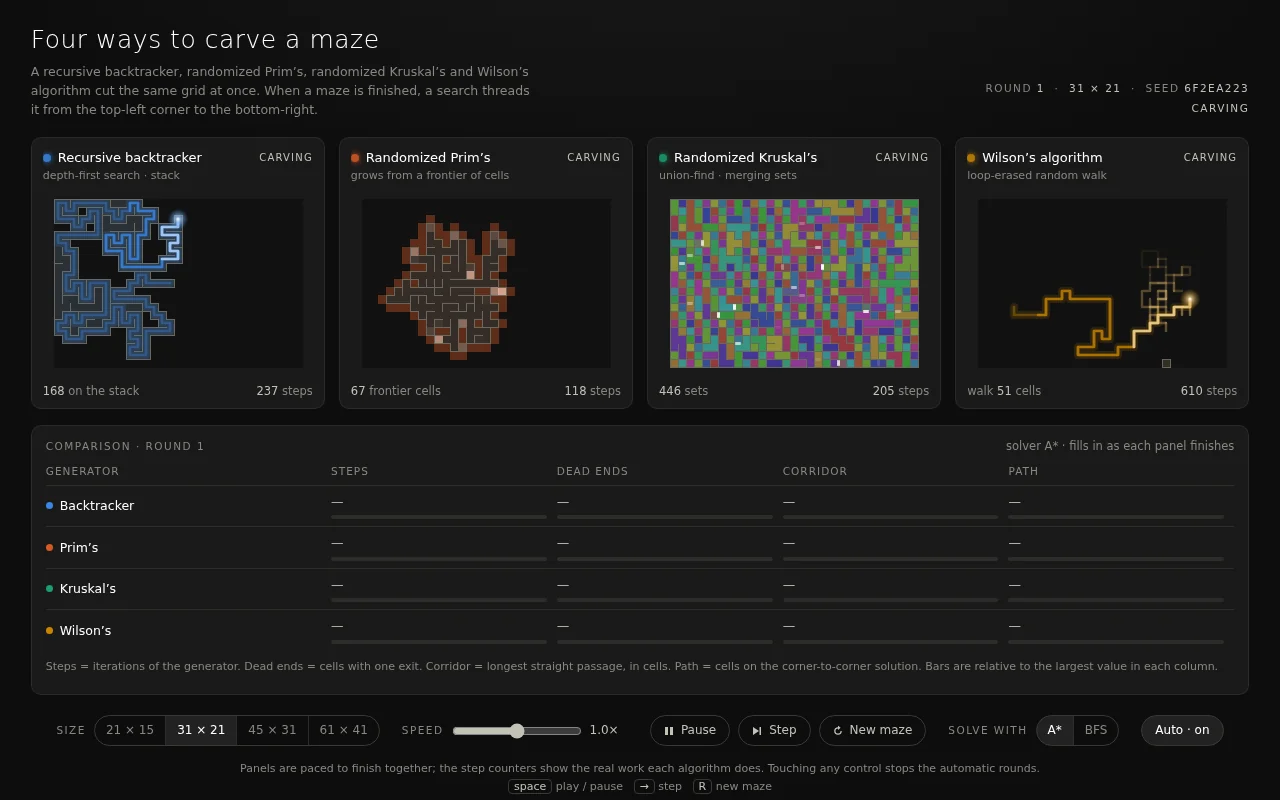
Open the live page in a new tab · Full result: prompt, transcript, cost and time
Claude Opus 5.5 Claude Code 2.1.280
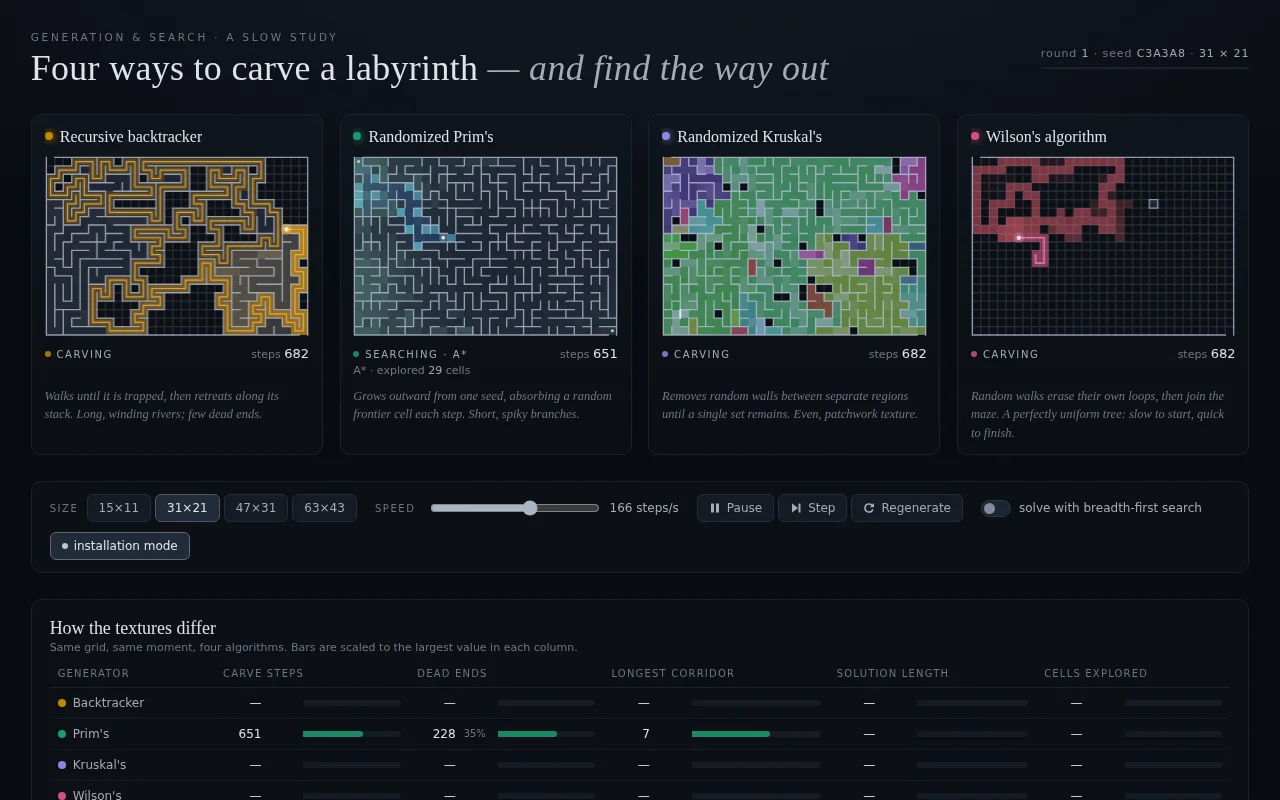
Open the live page in a new tab · Full result: prompt, transcript, cost and time
Claude Sonnet 5.5 Claude Code 2.1.280
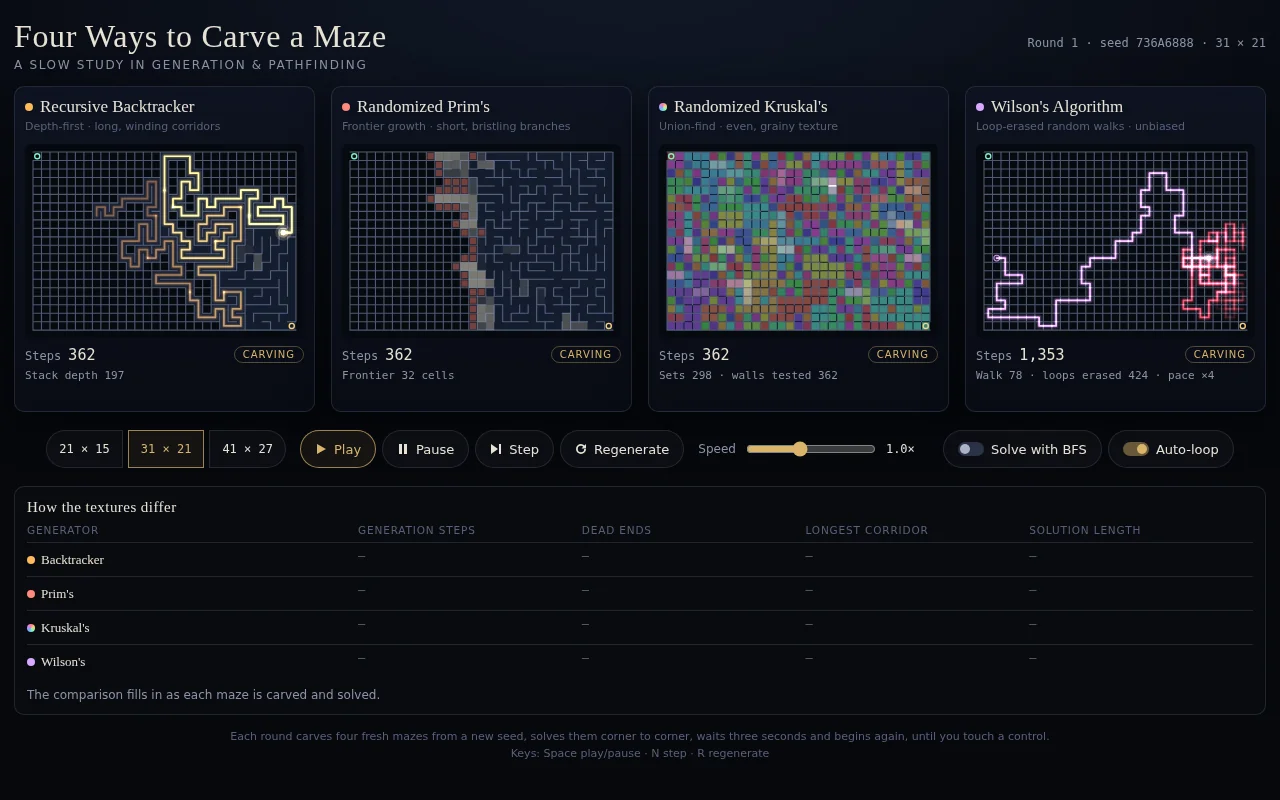
Open the live page in a new tab · Full result: prompt, transcript, cost and time
GPT-6 Astra Codex CLI 0.156.1
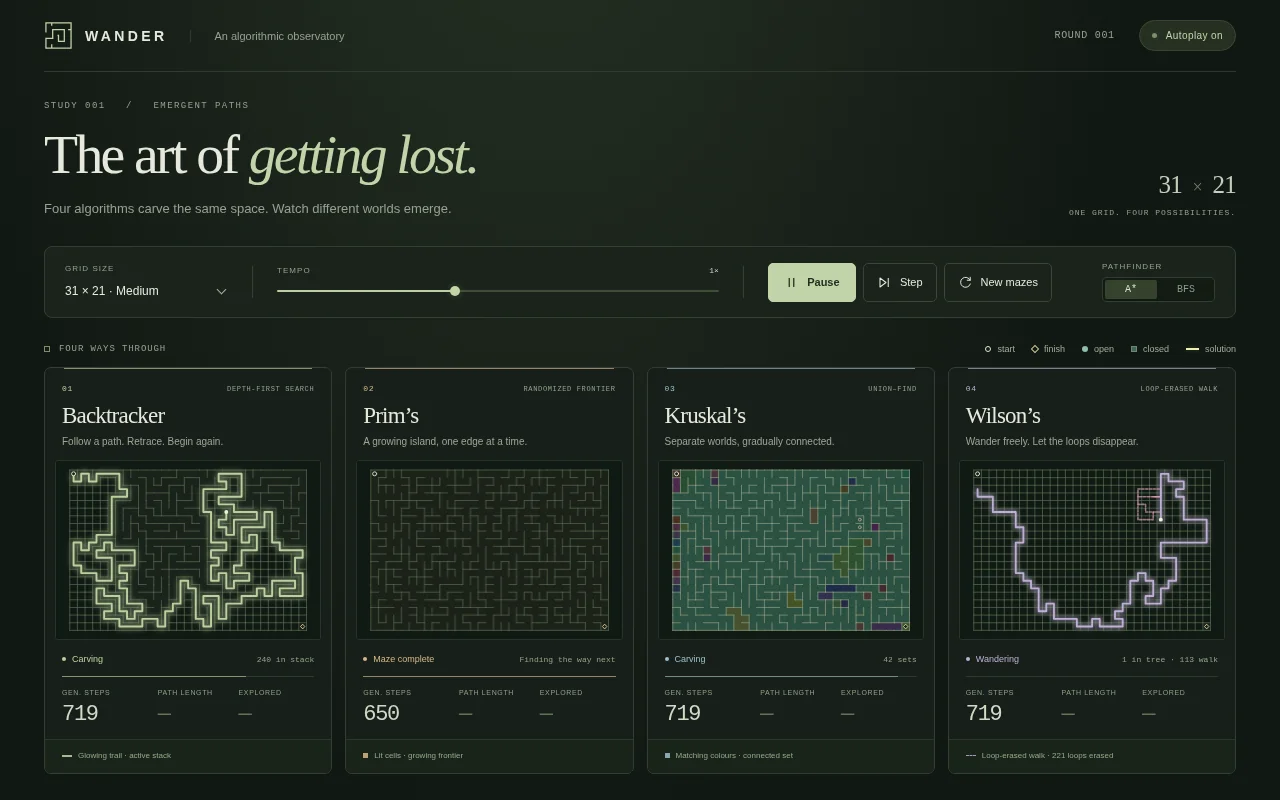
Open the live page in a new tab · Full result: prompt, transcript, cost and time
GPT-6 Astra OpenCode 1.18.32
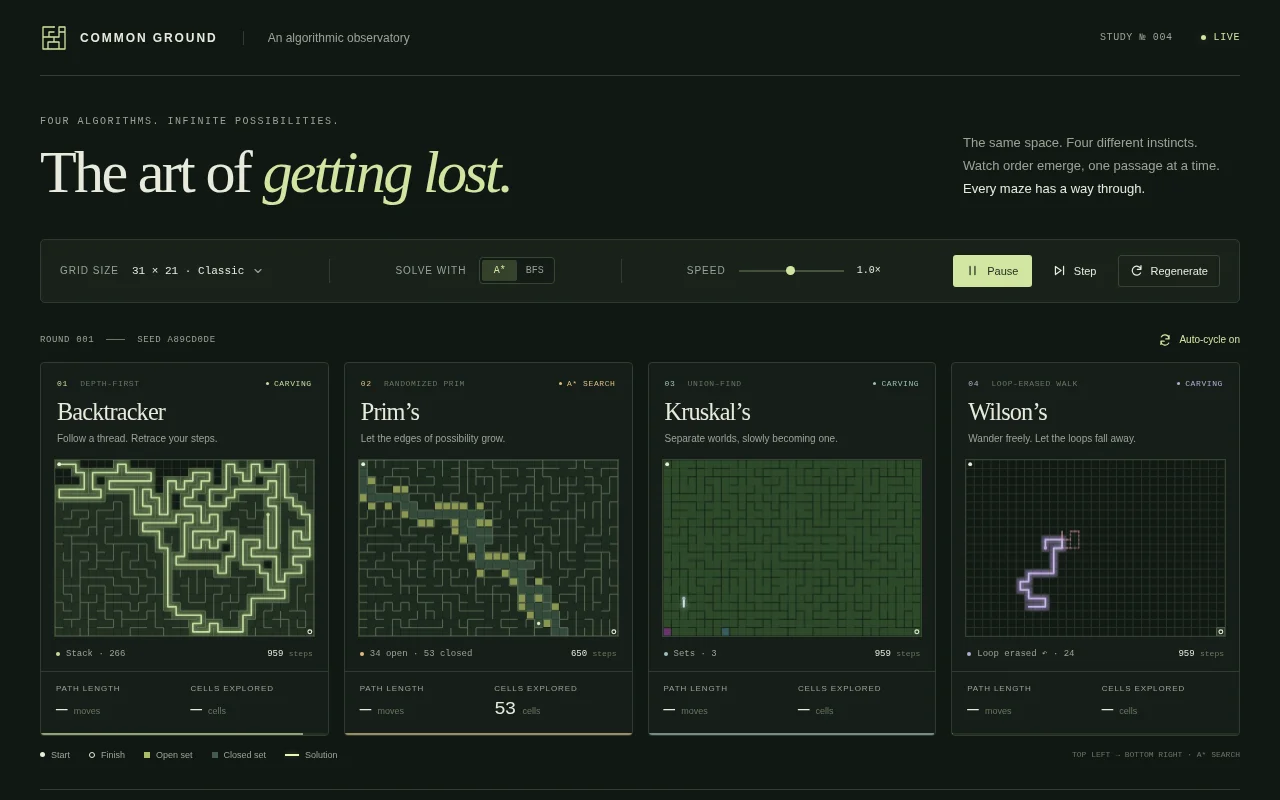
Open the live page in a new tab · Full result: prompt, transcript, cost and time
GPT-6 Sol Codex CLI 0.156.1
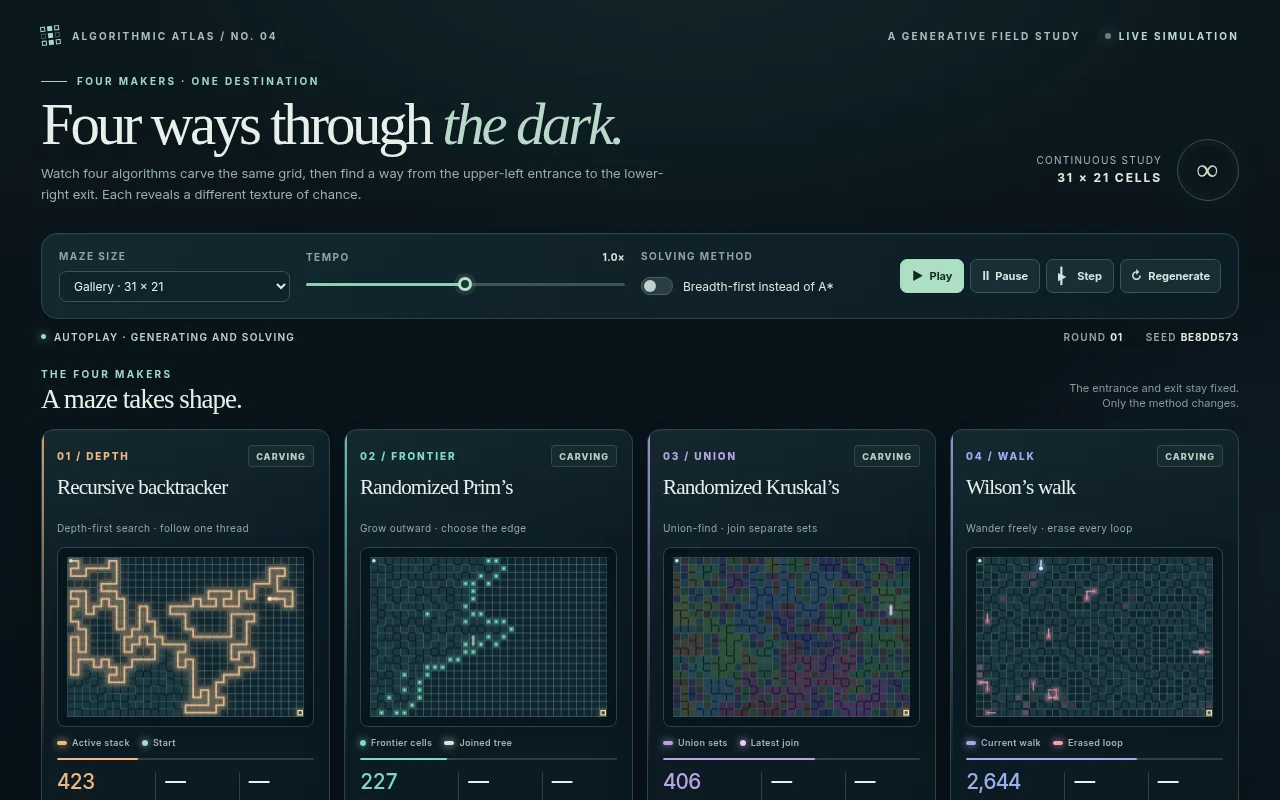
Open the live page in a new tab · Full result: prompt, transcript, cost and time
gpt-6.1-sol Codex CLI 0.156.1
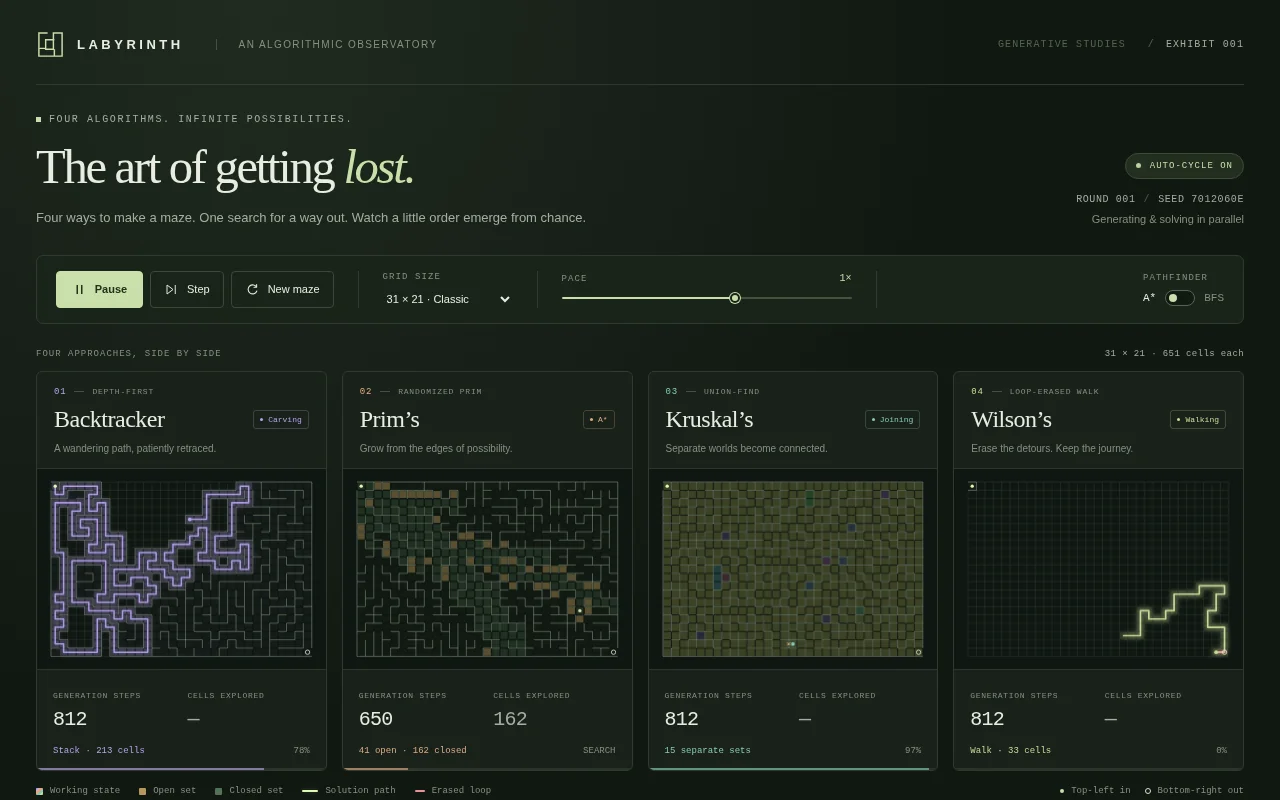
Open the live page in a new tab · Full result: prompt, transcript, cost and time
Edit distance dp Test page · 3 finished of 3
The prompt (the same for every model)
Build a dynamic programming visualizer centred on edit distance (Levenshtein). Show two words and the full DP table between them; fill it one cell per tick, for each cell highlighting the three neighbours it reads (left, up, diagonal), showing the candidate costs for insert, delete and substitute or match, and writing the minimum with a small pop. Colour the table as a heatmap as it fills. When the table is complete, trace back the optimal path from the bottom-right corner with a glowing line, then animate the alignment below: the first word morphing into the second letter by letter, with insertions, deletions and substitutions coloured and labelled, ending on the final distance. Beside it show a second, smaller panel solving the 0/1 knapsack problem (8 items, capacity 15) with the same cell-by-cell filling and a traceback that lights up the chosen items. Controls: two text inputs for the words, word-pair presets (kitten/sitting, intention/execution, sunday/saturday, algorithm/altruistic), speed slider, play, pause, step, reset, and a toggle to show the recurrence formula for the current cell. So the page is alive without input, on load it starts solving the first preset automatically and then cycles through the presets with a 3 second pause between them, forever, until the user touches a control. Make it the clearest explanation of dynamic programming anyone has seen. Save it as index.html in the current directory: one self-contained file with inline CSS and JavaScript only, no libraries or frameworks, and no external requests of any kind (no CDNs, web fonts, images or audio files). It must work when opened directly from disk, fit any window from a 390 px wide phone to a desktop, and run without console errors. You may serve it locally and open it in headless chromium (/usr/bin/chromium, software WebGL, no GPU) to screenshot and inspect your own output, and iterate on your own before finishing. Close any browser you open as soon as you've taken your screenshot.
Claude Sonnet 5.5 Claude Code 2.1.280
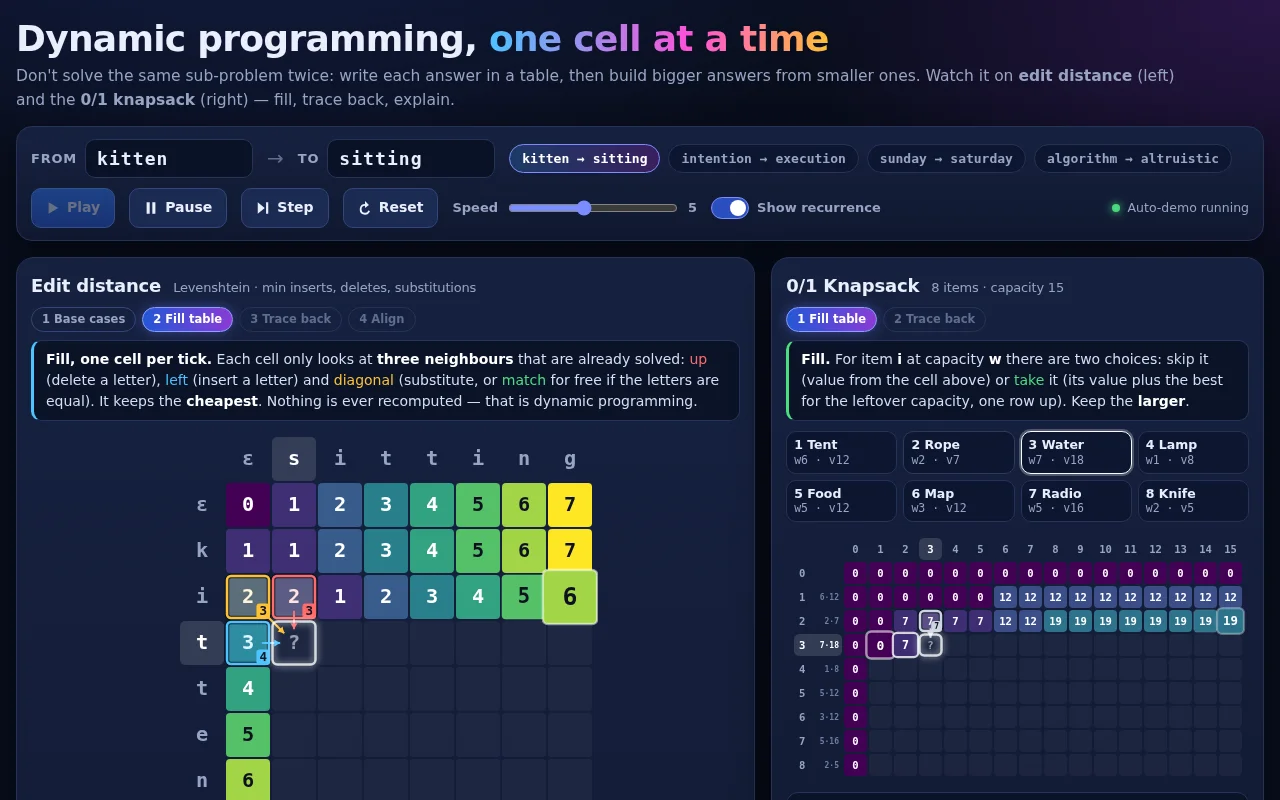
Open the live page in a new tab · Full result: prompt, transcript, cost and time
DeepSeek V4.1 Flash OpenCode 1.18.32
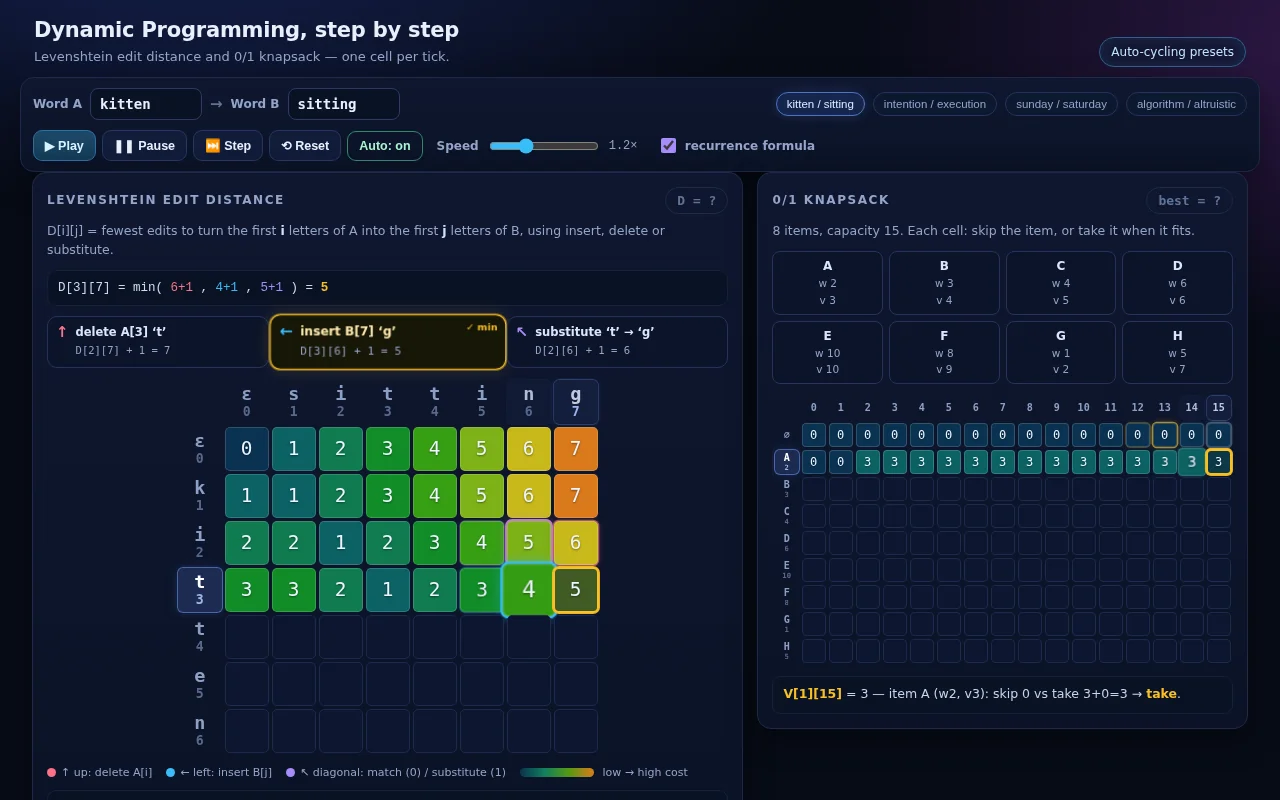
Open the live page in a new tab · Full result: prompt, transcript, cost and time
GPT-6 Astra Codex CLI 0.156.1
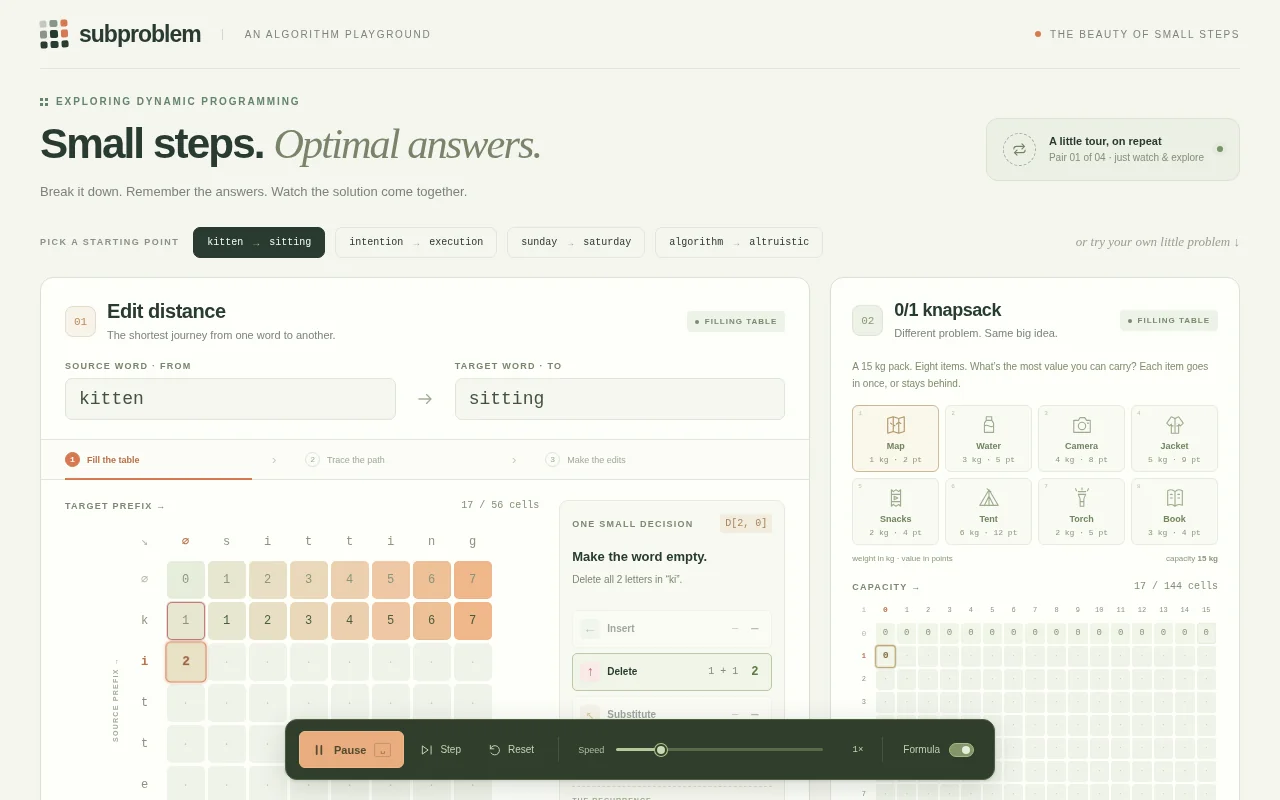
Open the live page in a new tab · Full result: prompt, transcript, cost and time
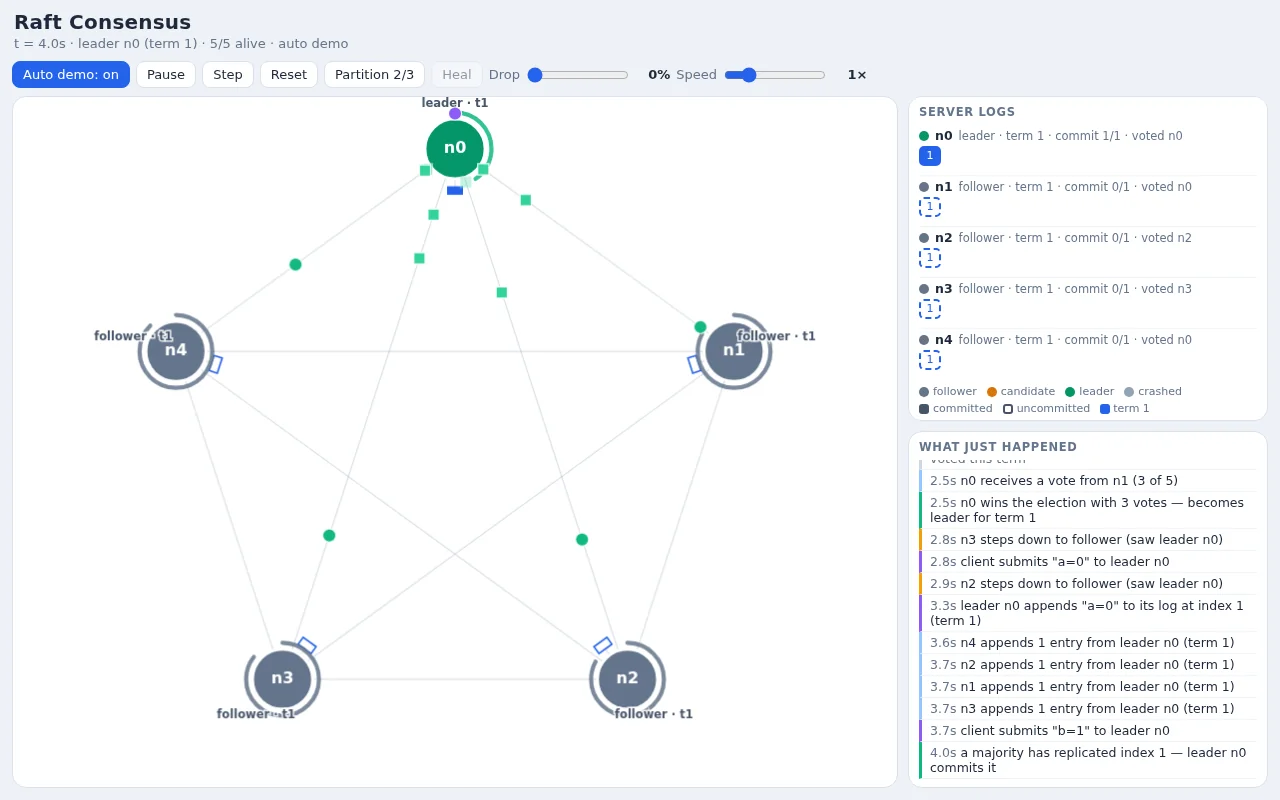
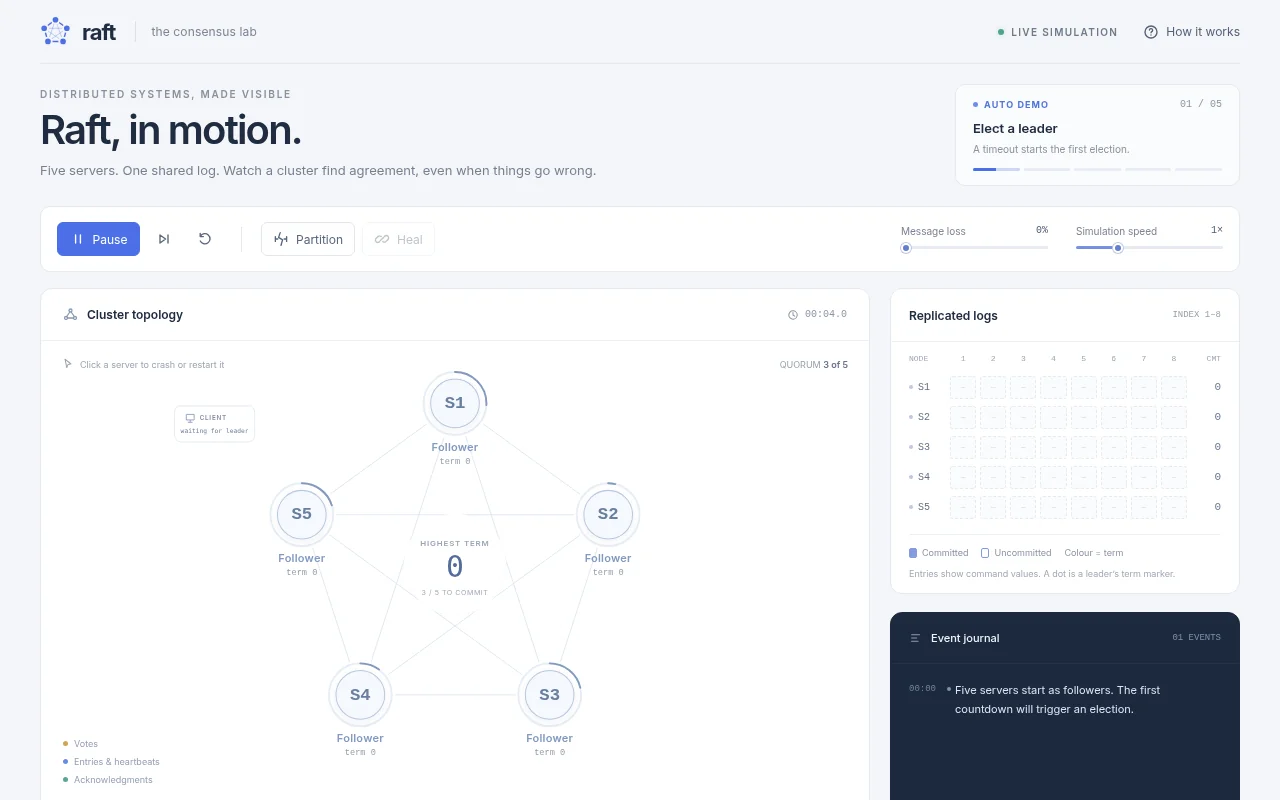
Raft consensus Test page · 2 finished of 2
The prompt (the same for every model)
Build an interactive visualization of the Raft consensus algorithm with five server nodes arranged in a circle. Implement the real protocol logic in JavaScript: follower, candidate and leader states, randomized election timeouts drawn as shrinking rings around each node, terms, RequestVote and AppendEntries messages animated as packets travelling along the links with their contents readable on hover or tap, vote granting rules, heartbeats, and log replication with each node's log shown as a row of coloured entries (term colour, committed entries solid, uncommitted hollow) and the commit index advancing when a majority acknowledges. Clients submit commands to the leader at a steady rate. Show an event log panel describing what just happened in plain language. Controls: click or tap a node to crash or restart it, a button to create a network partition that splits the cluster 2 / 3 and another to heal it, message drop-rate slider, speed slider, play, pause, step, reset. So the page is alive without input, on load it runs an automatic scenario forever: a leader is elected, commands replicate, the leader crashes and a new election happens, a partition creates a minority and a majority, the partition heals and the stale leader steps down, then it starts again, until the user touches a control. Make it calm, clear and correct, the way a distributed systems course would want to show it. Save it as index.html in the current directory: one self-contained file with inline CSS and JavaScript only, no libraries or frameworks, and no external requests of any kind (no CDNs, web fonts, images or audio files). It must work when opened directly from disk, fit any window from a 390 px wide phone to a desktop, and run without console errors. You may serve it locally and open it in headless chromium (/usr/bin/chromium, software WebGL, no GPU) to screenshot and inspect your own output, and iterate on your own before finishing. Close any browser you open as soon as you've taken your screenshot.
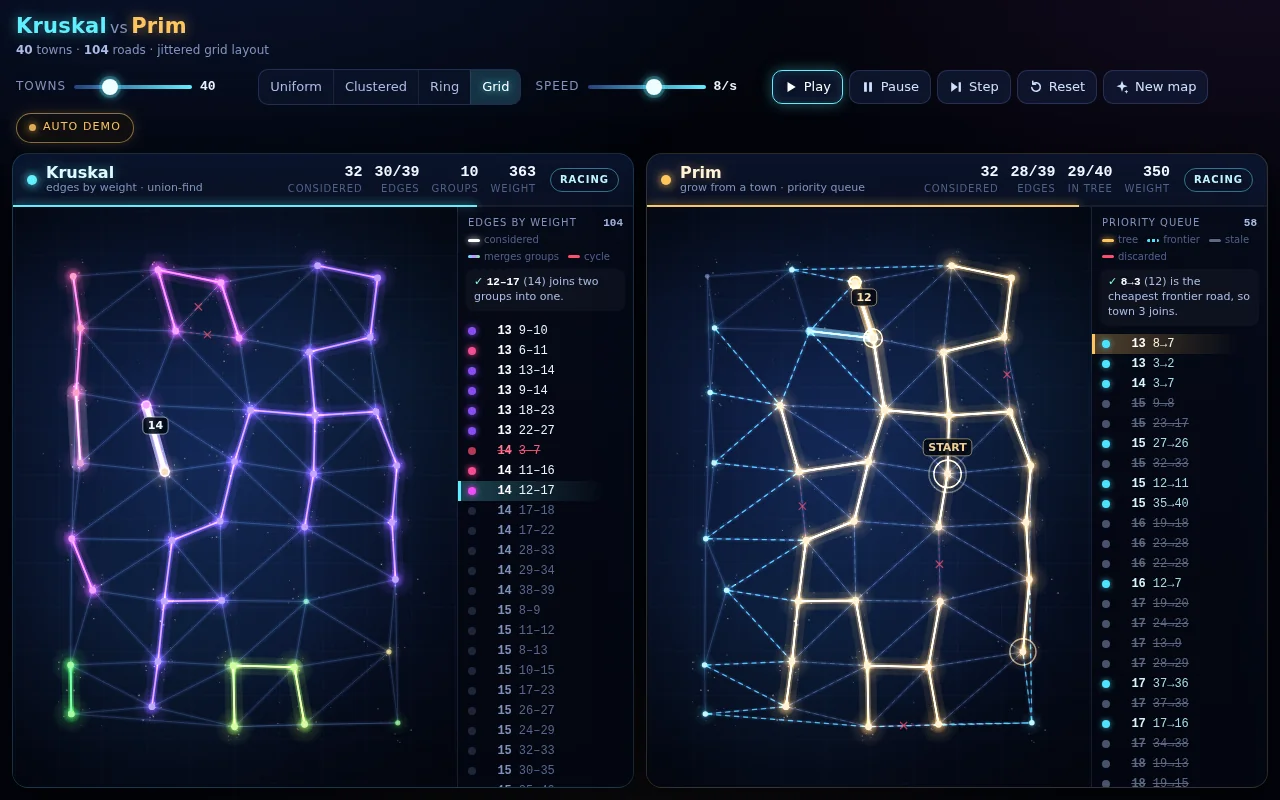
Mst kruskal prim Test page · 2 finished of 2
The prompt (the same for every model)
Build a minimum spanning tree race on a map of 40 towns: the towns are random points connected by a Delaunay-style or k-nearest-neighbour road network with weights equal to road length. Two panels side by side (stacked on narrow screens) run Kruskal's and Prim's algorithms at the same time on the same graph, one primitive step per tick. Kruskal's panel shows the edge list sorted by weight on the side with a cursor moving down it, each considered edge flashing, accepted edges turning bright, rejected edges (that would make a cycle) crossing out red, and the union-find forest drawn as coloured town groups that merge as edges are added. Prim's panel shows the growing tree from a starting town, the priority queue of frontier edges as a small sorted list, and the cheapest frontier edge being chosen each step. Count edges considered and total weight so far in each panel; when both finish, overlay them to show they found the same total weight, and highlight any edges where ties made them differ. Controls: town-count slider (10 to 120), layout presets (uniform, clustered, ring, grid with jitter), start town for Prim (click or tap a town), speed slider, play, pause, step, reset. So the page is alive without input, on load it races automatically and then starts a new random map after a 3 second pause, forever, until the user touches a control. Make it look like a beautiful glowing night map. Save it as index.html in the current directory: one self-contained file with inline CSS and JavaScript only, no libraries or frameworks, and no external requests of any kind (no CDNs, web fonts, images or audio files). It must work when opened directly from disk, fit any window from a 390 px wide phone to a desktop, and run without console errors. You may serve it locally and open it in headless chromium (/usr/bin/chromium, software WebGL, no GPU) to screenshot and inspect your own output, and iterate on your own before finishing. Close any browser you open as soon as you've taken your screenshot.
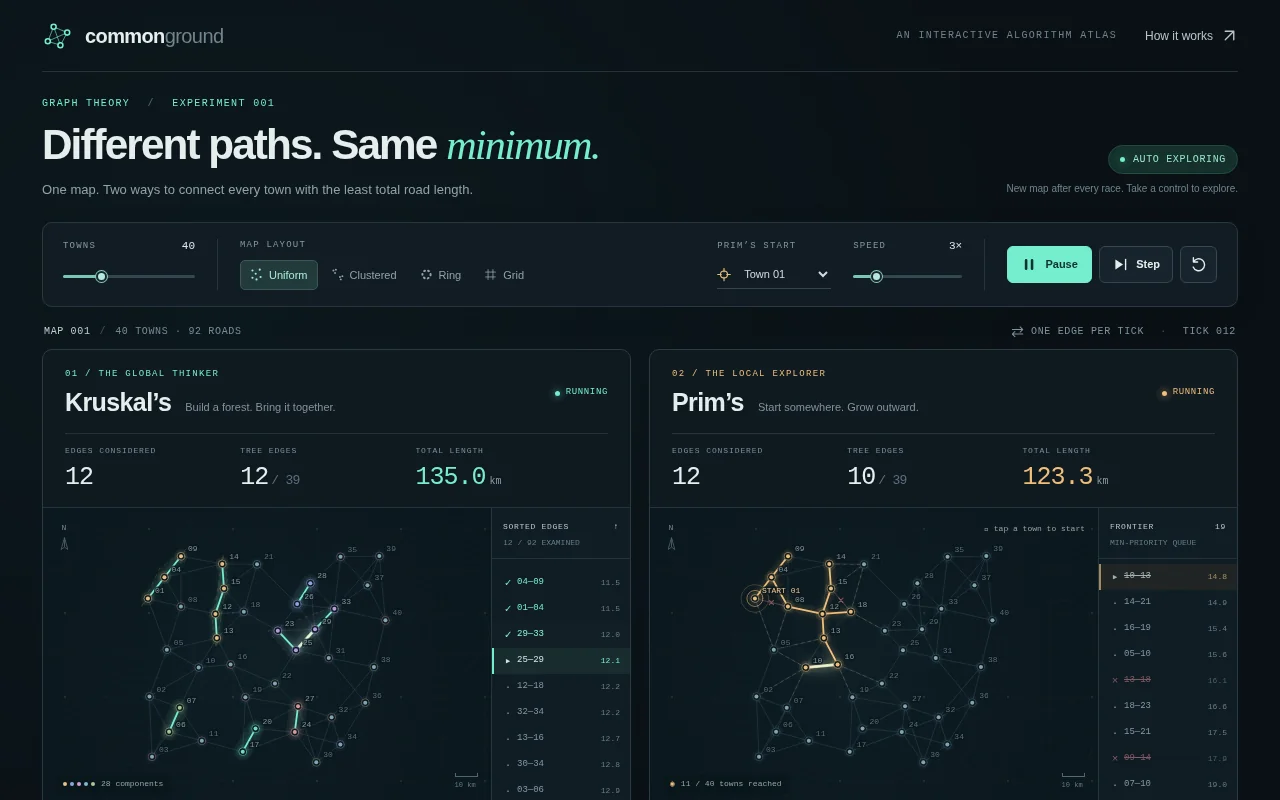
GPU boids 50k Test page · 5 finished of 5
The prompt (the same for every model)
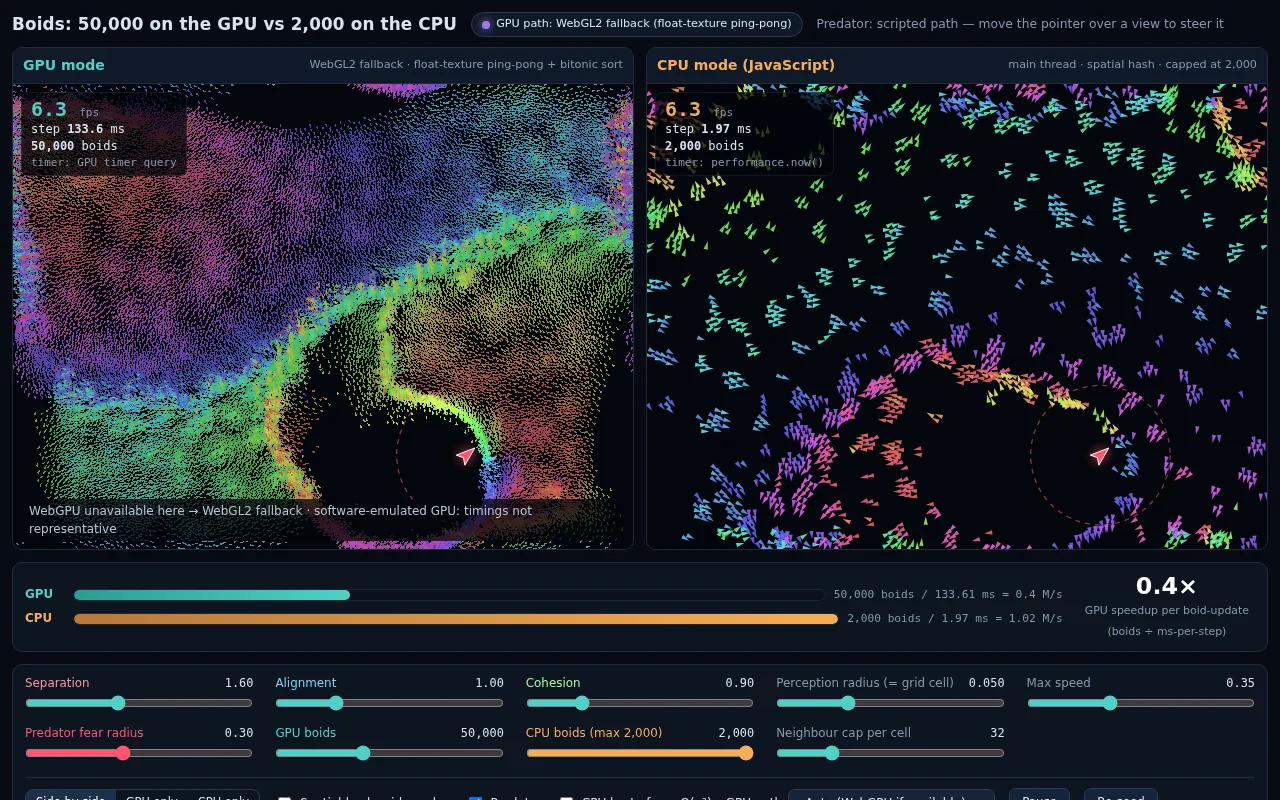
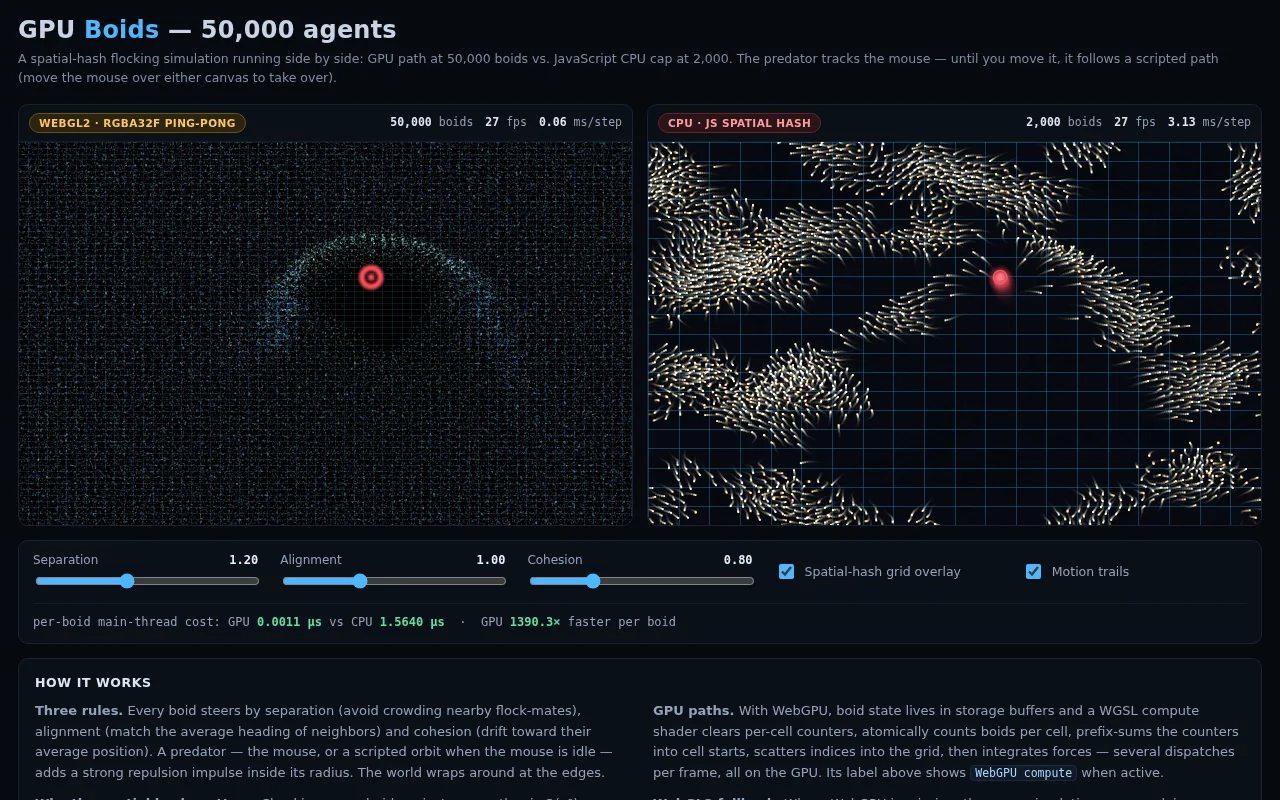
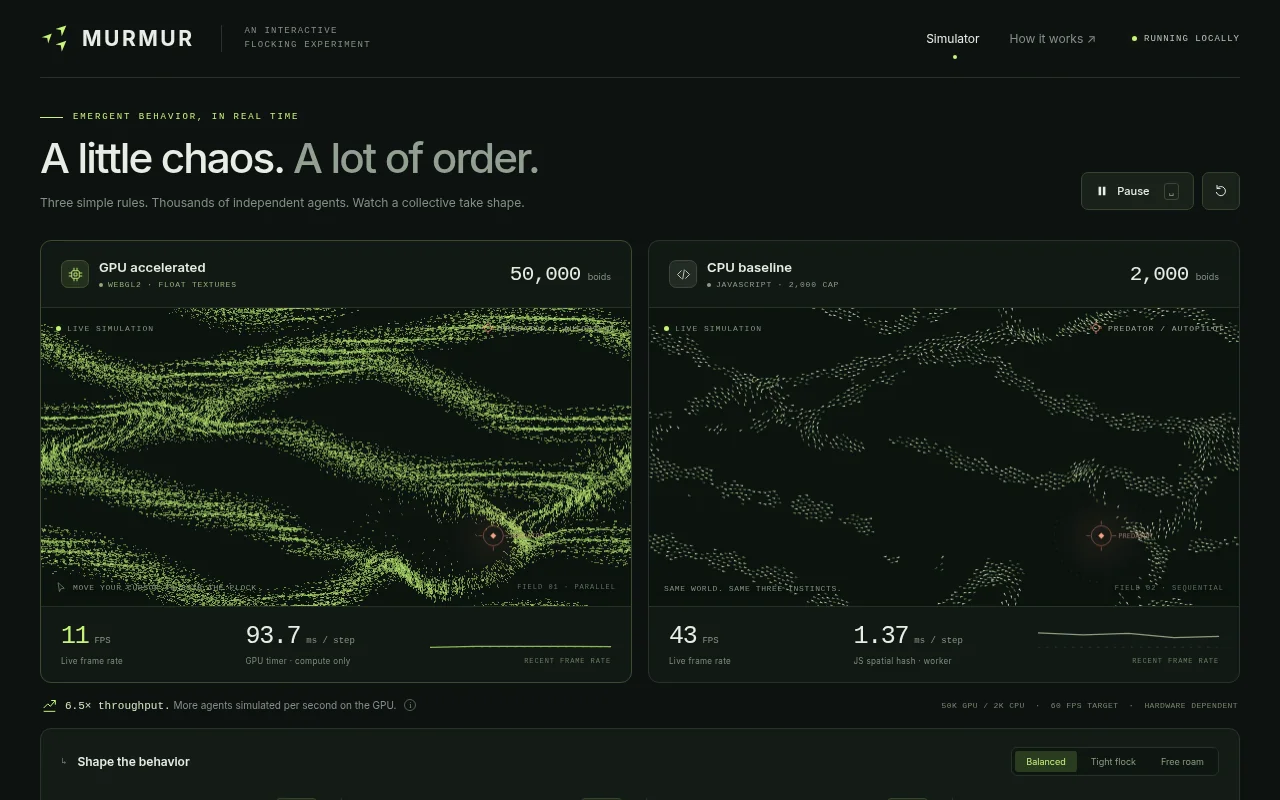
Build a single-page WebGPU compute-shader boids visualizer that runs 50,000 boids at 60fps, with a CPU (JS) mode capped at 2,000 for side-by-side comparison. Show separation/alignment/cohesion sliders, a predator that follows the mouse, spatial hashing grid overlay toggle, and an FPS + ms-per-step readout for each mode so the speedup is visible. Include a short in-page explanation panel of the algorithm and the spatial hash. One HTML file, no external assets. The GPU mode must use a WebGPU compute shader when navigator.gpu is available and otherwise fall back to a WebGL2 GPU path (for example float-texture ping-pong) so it still runs 50,000 boids where WebGPU is missing; label which GPU path is active. Make the page start a demo on load with no input (the predator follows a scripted path until the mouse moves) so a headless capture shows constant motion. Save it as index.html in the current directory: one self-contained file with inline CSS and JavaScript only, no libraries or frameworks, and no external requests of any kind (no CDNs, web fonts, images or audio files). It must work when opened directly from disk, fit any window from a 390 px wide phone to a desktop, and run without console errors. You may serve it locally and open it in headless chromium (/usr/bin/chromium, software WebGL, no GPU, no WebGPU) to screenshot and inspect your own output, and iterate on your own before finishing. Close any browser you open as soon as you've taken your screenshot.
Claude Opus 5.5 Claude Code 2.1.280
Open the live page in a new tab · Full result: prompt, transcript, cost and time
DeepSeek V4.1 Flash OpenCode 1.18.32
Open the live page in a new tab · Full result: prompt, transcript, cost and time
GPT-6 Astra Codex CLI 0.156.1
Open the live page in a new tab · Full result: prompt, transcript, cost and time
GPT-6 Astra OpenCode 1.18.32
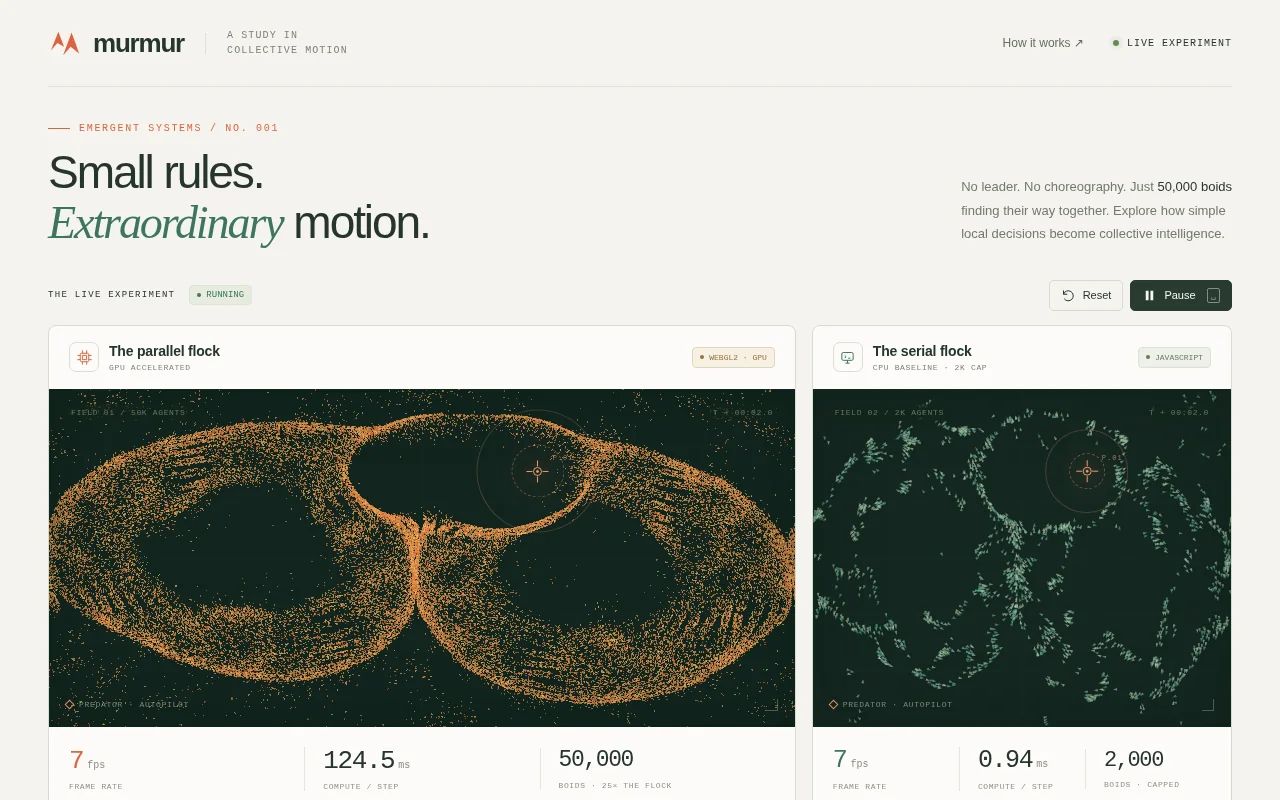
Open the live page in a new tab · Full result: prompt, transcript, cost and time
GPT-6 Sol Codex CLI 0.156.1
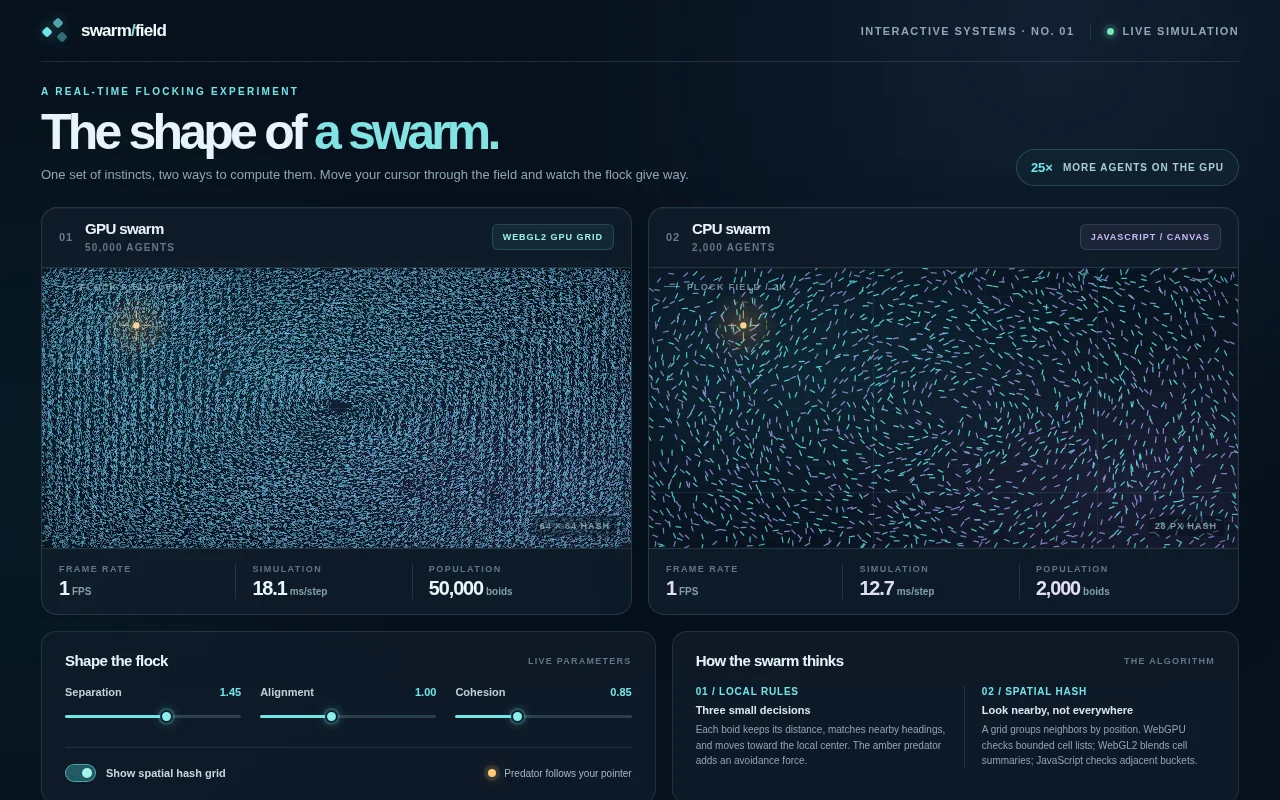
Open the live page in a new tab · Full result: prompt, transcript, cost and time